Fig. 1
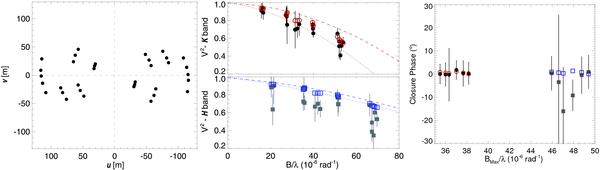
Left panel: (u,v) coverage of the observations. Observed squared visibilities (middle) and CP (right). H and K-bands data are represented by squares and circles symbols, respectively. Overplotted are the predictions from our best disk model (empty symbols). Dashed and dotted lines in the middle panels are a 2nd-order polynomial fit the modeled visibilities for the extreme values on Rin, inner disk within the uncertainties (see Sect. 3).
Current usage metrics show cumulative count of Article Views (full-text article views including HTML views, PDF and ePub downloads, according to the available data) and Abstracts Views on Vision4Press platform.
Data correspond to usage on the plateform after 2015. The current usage metrics is available 48-96 hours after online publication and is updated daily on week days.
Initial download of the metrics may take a while.