Free Access
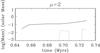
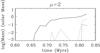
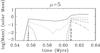
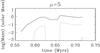
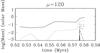
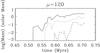
Fig. 11

Mass in the outflows as a function of time for various velocity thresholds (see text). The left column shows the high resolution simulations, while the right column shows the lower resolution. Top panels display the μ = 2 case, middle panels the μ = 5 ones, while the bottom panel displays μ = 120.
This figure is made of several images, please see below:
Current usage metrics show cumulative count of Article Views (full-text article views including HTML views, PDF and ePub downloads, according to the available data) and Abstracts Views on Vision4Press platform.
Data correspond to usage on the plateform after 2015. The current usage metrics is available 48-96 hours after online publication and is updated daily on week days.
Initial download of the metrics may take a while.