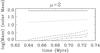
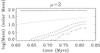
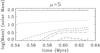
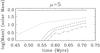
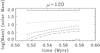
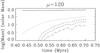
Fig. 1

Total mass above various density thresholds in the simulations as a function of time. Solid lines correspond to a density threshold of 103 cm-3, dotted lines to 105 cm-3, dashed to 107 cm-3, dot-dashed to 109 cm-3, triple dot-dashed to 1011 cm-3 and long-dashed to 1013 cm-3. The left column shows the high resolution simulations, while the right column shows the lower resolution. Top panels display the μ = 2 case, middle panels the μ = 5 ones, while bottom panels display the μ = 120 case.
Current usage metrics show cumulative count of Article Views (full-text article views including HTML views, PDF and ePub downloads, according to the available data) and Abstracts Views on Vision4Press platform.
Data correspond to usage on the plateform after 2015. The current usage metrics is available 48-96 hours after online publication and is updated daily on week days.
Initial download of the metrics may take a while.