| Issue |
A&A
Volume 528, April 2011
|
|
|---|---|---|
| Article Number | A147 | |
| Number of page(s) | 10 | |
| Section | Stellar structure and evolution | |
| DOI | https://doi.org/10.1051/0004-6361/201016045 | |
| Published online | 17 March 2011 | |
Monitoring a high-amplitude δ Scuti star for 152 days: discovery of 12 additional modes and modulation effects in the light curve of CoRoT 101155310 ⋆,⋆⋆
1 INAF – Osservatorio Astronomico di
Brera, via E. Bianchi
46, 23807
Merate (LC),
Italy
e-mail: This email address is being protected from spambots. You need JavaScript enabled to view it.
2 Institute of Astronomy, University of
Vienna, Türkenschanzstrasse
17, 1180
Vienna,
Austria
3 Konkoly Observatory,
PO Box 67, 1525
Budapest,
Hungary
4 Departamento de Astrofísica, CAB
(INTA-CSIC), PO Box
78, 28691 Villanueva de la
Cañada, Madrid,
Spain
5 Instituto de Astrofísica de
Andalucía, Apartado
3004, 18080
Granada,
Spain
6 Astronomical Institute of the Wroclaw
University, ul. Kopenika
11, 51-622
Wroclaw,
Poland
7 LESIA, Université Pierre et Marie
Curie, Université Denis Diderot, Observatoire de Paris, 92195
Meudon,
France
8 Institut d’Astrophysique Spatiale,
CNRS, Université Paris XI UMR 8617, 91405
Orsay,
France
9 Instituut Voor Sterrenkunde, Catholic
University of Leuven, Celestijnenlaan 200D, 3001
Leuven,
Belgium
Received:
2
November
2010
Accepted:
25
January
2011
Abstract
Aims. The detection of small-amplitude nonradial modes in high-amplitude δ Sct (HADS) variables has been very elusive until at least five of them were detected in the light curve of V974 Oph obtained from ground-based observations. The combination of radial and nonradial modes has a high asteroseismic potential, thanks to the strong constraints we can put in the modelling. The continuous monitoring of ASAS 192647-0030.0 ≡ CoRoT 101155310 (P = 0.1258 d, V = 13.4) ensured from space by the CoRoT (COnvection, ROtation and planetary Transits) mission constitutes a unique opportunity to exploit such potential.
Methods. The 22270 CoRoT measurements were performed in the chromatic mode. They span 152 d and cover 1208 consecutive cycles. After the correction for one jump and the long-term drift, the level of the noise turned out to be 29 μmag. The phase shifts and amplitude ratios of the coloured CoRoT data, the HARPS spectra, and the period-luminosity relation were used to determine a self-consistent physical model. In turn, it allowed us to model the oscillation spectrum, also giving feedback on the internal structure of the star.
Results. In addition to the fundamental radial mode f1 = 7.949 d-1 with harmonics up to 10f1, we detected 12 independent terms. Linear combinations were also found and the light curve was solved by means of 61 frequencies (smallest amplitude 0.10 mmag). The newest result is the detection of a periodic modulation of the f1 mode (triplets at ± 0.193 d-1 centred on f1 and 2f1), discussed as a rotational effect or as an extension of the Blazhko effect to HADS stars. The physical model suggests that CoRoT 101155310 is an evolved star, with a slight subsolar metallic abundance, close to the terminal age main sequence. All the 12 additional terms are identified with mixed modes in the predicted overstable region.
Key words: stars: variables:δScuti / stars: oscillations / stars: interiors / stars: individual: CoRoT 101155310
The CoRoT space mission was developed and is operated by the French space agency CNES, with the participation of ESA’s RSSD and Science Programmes, Austria, Belgium, Brazil, Germany, and Spain. This work uses ground-based spectroscopic observations made with the HARPS instrument at the 3.6 m-ESO telescope (La Silla, Chile) under the ESO Large Programme LP182.D-0356 and complementary photometric measurements made at the Piszkéstető Mountain Station of Konkoly Observatory (Hungary).
Table 1 is also, and Table 2 only, available in electronic form at the CDS via anonymous ftp to cdsarc.u-strasbg.fr (130.79.128.5) or via http://cdsarc.u-strasbg.fr/viz-bin/qcat?J/A+A/528/A147
© ESO, 2011
1. Introduction
High-amplitude δ Sct (HADS) stars occupy the central part of the lower part of the instability strip between the horizontal branch and the main sequence (McNamara 2000). In the same region of the instability strip, low-amplitude δ Sct stars span a wider range of temperatures and luminosities. The phenomenological separation is based on an amplitude limit of 0.20 − 0.30 mag, but actually it has never been considered as physically significant. Moreover, HADS stars could not be further considered mono- or double-mode radial pulsators after detecting additional modes (Poretti 2003, and references therein). Their identification as nonradial modes opened the possibility of considering HADS stars as new tools for asteroseismic studies. Indeed, recent theoretical investigations (Suárez et al. 2006a, 2007) indicate that rotation effects may provide useful additional information on the mode identification, in particular for the nonradial modes rotationally coupled with the fundamental and first-overtone radial modes. That large amplitude modes could be identified as radial allowed us to use HADS stars as distance indicators (Poretti et al. 2008; Garg et al. 2010). The most luminous HADS stars are just below the horizontal branch, and the debate whether the light curves of HADS stars could show similarities with those of RR Lyr stars is still open (Breger 2010).
A great improvement in the observational techniques and data quality was needed to investigate both the pulsational content and the behaviour of the predominant radial modes. This opportunity could only be offered by a space mission.
2. The CoRoT data
The variability of the 13th–mag star located at α = 19h26m , δ = –00°30′01
 44 (J2000) was discovered during the ASAS survey (All Sky Automated Survey; Pojmanski 2000). The star is named 192647-0030.0 and classified as a δ Sct variable with P = 0.1258 d in the ASAS catalogue (http://www.astrouw.edu.pl/asas/). This part of sky, i.e., the equatorial plane not far from the galactic centre, is well within one of the “eyes” of the CoRoT space mission (COnvection, ROtation and planetary Transits; Baglin et al. 2006; Auvergne et al. 2009). The inclusion of ASAS 192647-0030.0 in the exoplanetary field of the first long run in the direction of the galactic centre (LRc01) was done after searching the catalogue compiled by Benkő & Csubry (2007). Therefore, we specifically requested the CoRoT monitoring of ASAS 192647-0030.0 as part of the Additional Programmes (Weiss 2006). In the CoRoT database the star was named CoRoT 101155310 ≡ USNOA2 0825-15821309 (V = 13.43, B − V = + 0.60, V − R = 0.21; Deleuil et al. 2009). There is no relevant contamination from nearby stars, since the brightest star included in the CoRoT mask is 2.9 mag fainter than CoRoT 101155310 in V light (Deleuil et al. 2009). The “CoRoT Variability Classifier” automated supervised method (Debosscher et al. 2009) classified it as an RR Lyr star only on the basis of the Fourier parameters. Since some overlap is present with the HADS stars in this parameter space (Poretti 2001), the classification system has been consequently revised to better separate RR Lyr from HADS stars.
The LRc01 started on May 15, 2007 and finished 152 d later, on October 14, 2007. This means that CoRoT 101155310 was monitored for 1208 consecutive cycles. The exposure time in the CoRoT exoplanetary channel was 512 s. This value remained constant over the long run, since no regular feature suggesting planetary transit was noticed. The Heliocentric Julian Dates (HJD) were reported to the times at half exposure. The very high duty cycle allowed us to collect 25597 datapoints. CoRoT 101155310 was observed in the chromatic mode, by means of a bi-prism located in the focal block of the instrument, between the dioptric objective and the plane of the detectors (Barge et al. 2006). The image is a small, low-resolution spectrum whose area is about 300 arcsec2 on the sky. The photometry is performed in three different colours, roughly red (rC), green (gC), and blue (bC), to supply a tool able to distinguish between planetary transits (colour independent) and stellar activity (changing with the wavelength). The white light, i.e., the sum of the three contributions, is more suitable for signal detection thanks to its larger number of counts. CoRoT 101155310 was also observed with the 1.0 m telescope of the Konkoly Observatory at the the Piszkéstető Mountain Station (Hungary) on two nights in June 2009. CCD photometry with standard BVI filters was planned to compare the amplitudes in the CoRoT passbands with those in standard ones. The 88 measurements in each filter cover one complete pulsational cycle, and we could also determine one time of maximum brightness.
The CoRoT measurements are a sort of absolute photometry, since the measured flux is not corrected with respect to any reference source or star. Therefore, instrumental changes and drifts have a direct influence on it, on both short- and long-term scales. Different detrending algorithms can be used, based on moving means or polynomial fits. After several trials, we were more satisfied by an approach based on a preliminary frequency analysis. Indeed, the main frequency f1 = 7.949 d-1 and other high-amplitude terms were immediately detected in the raw data. We calculated the least-squares fit of the raw data by using a preliminary solution based on the terms with the largest amplitudes. The residuals in white light (Fig. 1, upper panel) show a long-term drift and more rapid and apparently irregular changes around JD 2 454 253 and 2 454 267. Moreover, in the second half of the observations the distribution of the outliers strongly changed and many points appeared well below the others. This so-called “rain” of points from the middle strip has an instrumental origin because it is observed in other stars belonging to the same pointing. To correct the irregular behaviour of the mean magnitude we calculated the least-squares fits on four consecutive cycles. These fits returned the 302 values of the mean magnitudes (Fig. 1, upper curve in the middle panel), which mimics the trend of the residuals. The standard deviations of the 302 solutions range from 0.004 to 0.016 mag. To remove the instrumental variations, we interpolated the values of the mean magnitudes at the time of each individual measurement of CoRoT 101155310 and then subtracted it.
After that, we recalculated the least-squares fits on the 302 bins and obtained very homogeneous values of the mean magnitudes (Fig. 1, lower curve in the middle panel). By applying this procedure we also removed any oscillation around 0.5 d, but as we see later (Sect. 3.4) this did not have a strong impact on our solution. At this stage we also removed the outliers. A post-facto analysis of the raw and the cleaned datasets showed that the frequency content of the two timeseries is the same. The bottom panel of Fig. 1 shows an example of the excellent quality of the final timeseries and also allows us to appeciate the continuous CoRoT monitoring.
The same technique was applied to the coloured data. The trend in rC light is roughly the same as in white light (top panel of Fig. 1), since the total flux in this light (about 182 000 adu) is much greater than of gC (about 22 600 adu) and bC (about 32 300 adu). The main difference is in the decline after JD 2 454 310, which is sharper in rC light than in white light. Actually, the fluxes observed in the gC and bC light increased after this date, and what we measured in white light is the total flux variation. This changeover concerns those days when the “rain” effect appeared, and it is very probably a jitter effect through the photometric mask of CoRoT 101155310.
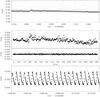 |
Fig. 1 Top panel: curve of the residuals (a preliminary solution was subtracted from the original data) showing the long- and short-term instrumental effects. Middle panel: behaviour of the mean magnitudes before (upper curve) and after (lower curve) the removal of the instrumental effects shown in the upper panel. Each bin spans four pulsational cycles. Bottom panel: the example extracted from the final timeseries of CoRoT 101155310 shows the continuous monitoring obtained from space by CoRoT. |
3. The frequency content
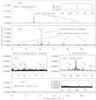 |
Fig. 2 Subsequent steps in the detection of frequencies in the amplitude spectra of CoRoT 101155310. |
The frequency analyses were performed on different versions of the CoRoT timeseries (raw data, detrended data, coloured data, with and without outliers, etc.) and they supplied very similar results. The main change is in the level of the noise and consequently in the threshold for the significance of the peaks. Therefore, for the sake of clarity, we discuss here the detection performed in white light. The frequency values were firstly obtained by means of the iterative sine-wave, least-squares fitting method (Vaniček 1971) and then refined by the MTRAP algorithm (Carpino et al. 1987), both at intermediate stages and at the end of the whole analysis.
The level of the noise in the final timeseries (22270 datapoints in white light) is 29 μmag in the 0 − 100 d-1 region. The long-term drift left a slightly higher noise in the 0 − 5 d-1 region, namely 41 μmag. We accepted 61 peaks as having a stellar origin, i.e., not counting the orbital frequency of the satellite forb = 13.97 d-1, the sidereal frequency fsid = 1.0027 d-1, and their harmonics and combinations. To do that, we firstly considered the peaks with an amplitude greater than 0.12 mmag, i.e., with a signal-to-noise ratio (SNR) above 4.0. Then, we noted that several combination terms (harmonics and coupling terms) were also detected below this limit. Therefore, we relaxed the minimum amplitude to 0.10 mmag, i.e., 3.5 times the noise level. Some combination terms (e.g., f1 + f2 + f3, 4f1 − f4, 3f1 + f5) are just below the acceptance threshold.
Figure 2 shows the steps in the solution of the CoRoT light curve of CoRoT 101155310, which led to the detection of four categories of frequencies:
-
1.
the predominant term f1 and its harmonics;
-
2.
the independent terms, from f2 to f13;
-
3.
the modulation term fm of the term f1;
-
4.
the combination terms.
Identification, frequencies, Fourier amplitudes, and phases (T0 = HJD 2 454 236.7502) of the terms detected in the data of CoRoT 101155310 (22 270 datapoints).
The parameters of the least-squares solution (cosine series) based on the 61 frequencies thus detected are listed in Table 1. The residual rms is 0.0027 mag. The values of the harmonics and combination terms were obtained from the values of the independent frequencies and from the modulation frequency fm = 0.1933 d-1, for which formal errorbars (Montgomery & O’Donoghue 1999) are given between brackets. This “locked” solution was calculated by means of the MTRAP algorithm (Carpino et al. 1987). The residual spectrum (Fig. 2, panel e) shows some peaks at the values of the linear combinations of forb = 13.97 d-1 and fsid = 1.0027 d-1. These spurious peaks are due to the passage of the satellite over the South Atlantic Anomaly, which occurred twice daily. The environmental conditions (e.g., the effects of the eclipses on the electronics units, the eclipse durations, the difference in the Earth’s albedo of the overflown regions; Auvergne et al. 2009) are affecting the CoRoT photometry in such a complicated way that, as in the case of CoRoT 101128793 (Poretti et al. 2010), the usual technique of prewhitening was not able to clean the data in a satisfactory way.
3.1. The f1 term and its harmonics
The peaks at f1 = 7.949 d-1, 2f1, and 3f1 clearly stand out in the amplitude spectrum of the original data (Fig. 2, panel a). The spectral window is free of any relevant alias structure, the highest peak being at the power level of 0.005 (see the inserted box). We detected harmonics up to 10f1 in the CoRoT light curve, i.e., about twice those detected in ground-based timeseries. Since the amplitude of harmonics is monotonically decreasing, the light curve is smoothed (Fig. 3, upper panel), without the bumps observed in RR Lyr stars, both monoperiodic (Poretti 2001) and multiperiodic (Chadid et al. 2010; Poretti et al. 2010).
The Fourier parameters (φ21 = 4.19 rad, φ31 = 2.04 rad, φ41 = −0.27 rad, and R21 = 0.38) are in excellent agreement with those calculated from the OGLE light curves of HADS stars (Poretti 2001). These parameters suggest that CoRoT 101155310 is pulsating in the fundamental radial mode.
We calculated the times of the maximum brightness by fitting the measurements of the well-covered cycles with a cubic spline. In such a way we could determine 1090 times of maxima (Table 2) and in turn the ephemeris 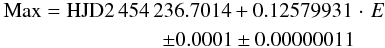 by means of a least-squares line. The O − C values (differences between the observed and calculated times of maxima, also listed in Table 2) were determined by using this ephemeris. The CCD BVI measurements performed at the Piszkéstető Observatory in 2009 provide an excellent validation. The maximum in I light was observed at HJD 2 455 011.4997 when the above ephemeris predicts HJD 2 455 011.4994 ± 0.0007 for E = 6159. The light curve of this maximum is flatter than those of the B and V curves, whose maxima were observed at HJD 2 455 011.4933 and HJD 2 455 011.4910, respectively.
3.2. The independent terms
Twelve independent frequencies were found in the interval 8.23−13.22 d-1, i.e., at periods shorter than that of the fundamental radial mode f1 (Table 1). These additional modes could not be detected in the ASAS timeseries since the level of the noise is much higher (0.020 and 0.025 mag in V and I, respectively) than their amplitudes (0.006 mag or less).
A close, but non-equidistant triplet of frequencies (f2 = 10.48, f3 = 10.69, and f4 = 10.85 d-1, Fig. 2, panel b) appears at an amplitude level similar to that of 4f1, i.e., in the 3.0−6.2 mmag range. Is CoRoT 101155310 a double-mode HADS star? The frequency ratio between the fundamental and first overtone modes in HADS stars is well constrained in the 0.771−0.774 interval (see Table 2 and Fig. 4 in Poretti et al. 2005). In turn, this implies that the first overtone of CoRoT 101155310 is expected in the interval 10.27−10.31 d-1. None of the terms of the triplet matches this value and so the triplet is composed of nonradial modes.
The amplitude of f4 is half that of f3, and this ratio is also maintained for f5, f6 (Fig. 2, panel b), and f7. After f7 (amplitude 0.27 mmag), the amplitude of the subsequent terms is slightly decreasing and we detected four other modes (f8,f9,f10, and f11) in less than 0.10 mmag (Fig. 2, panel c). Still, no regular separation is observed among these peaks. More generally, we did not find the same separation between two terms from f1 to f13. Regarding the identification of the first radial overtone, the f9 term provides the ratio closest to the expected one, but it appears too discrepant (see also Sect. 6).
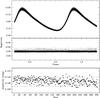 |
Fig. 3 Top panel: the CoRoT data folded with the main pulsational frequency f1 (upper curve) and the residuals after prewhitening of the 61 frequencies (lower curve). Bottom panel: amplitudes of the f1 term calculated from measurements spanning four consecutive pulsational cycles. |
3.3. The modulation of the f1 component
The side peaks of f1 (7.7559 and 8.1424 d-1; Fig. 2, panel d) and 2f1 (15.7051 and 16.0912 d-1) are the most surprising features in the amplitude spectrum of CoRoT 101155310. They form an equidistant triplet with a frequency separation fm= 0.193 d-1. In practice, this triplet is the signature of a modulation of the main component f1. The amplitudes of the modulation terms are much smaller than those of the independent terms discussed above. This hampers any direct detection of the periodicity in the O–C or the magnitude-at-maximum diagrams, since the effects of the independent modes mask those of the modulation, also taking the long (512 s) CoRoT exposures into account. The residual signal left around f1 (noted as “Long term” in Fig. 2, panel d) will be discussed in Sect. 7.2.
The two frequencies f12 = 9.325 and f13 = 8.354 d-1 are close, but not coincident, to the combination terms f5 – fm = 9.340 d-1 and f1 + 2fm = 8.335 d-1. The hypothesis that they are actually combination terms implies an fm value significantly different from 0.193 d-1 (0.208 and 0.202 d-1, respectively). Therefore, we should admit that the modulation is not the same or that these two frequencies are independent modes. Since the occurrence of a combination term such as f5 – fm is quite unusual we prefer the latter explanation.
3.4. The combination terms
The amplitude spectrum of CoRoT 101155310 is also rich in combination terms (Fig. 2, panel b), as expected from the amplitude of the independent terms from f1 to f5, greater than 1 mmag. The terms involving differences were also detected, and the lowest frequency is f5 − f1 = 1.58 d-1. We can argue that the bin on four pulsational cycles (i.e., 0.5 d) did not hamper detection of peaks below 2 d-1, if any. Patterns of combination terms with the harmonics up to 5f1 are detected between f1 and f2, f1 and f3, f1 and f4, up to 2f1 with f5 and f6. Only four frequencies (3f1 − f2 = 13.00 d-1, 3f1 − f3 = 13.37 d-1, 3f1 − f4=13.16 d-1, and f1 + f5 = 17.48 d-1) are within the interval 7 − 18 d-1. We considered them as combination terms rather than independent modes, since they follow the patterns described above closely (see also Table 1). We also detected the term f2 + f3, i.e., the one involving the additional terms with the largest amplitudes. The modulation does not affect the combination terms; i.e., we did not detect any term having the form f1 ± fm ± fi.
4. The fit of the light curves in the different CoRoT passbands
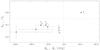 |
Fig. 4 Phase shifts and amplitude ratios of the frequencies from f1 to f6 as obtained from CoRoT coloured timeseries. |
Calculation of the phase differences and amplitude ratios in different passbands could allow the mode identification (Garrido 2000). Unfortunately, the CoRoT photometric system is not a well-defined one, depending on the star itself (see Sect. 7 in Barge et al. 2006). To perform a comparative procedure, we calculated the least-squares fits of the coloured CoRoT and BVI Konkoly timeseries. The full amplitudes of the light variations of CoRoT 101155310 are 0.432, 0.385, and 0.273 mag in the bC, gC, and rC CoRoT passbands and 0.459, 0.367, and 0.215 mag in the BVI filters, respectively. Therefore, the bC and gC passbands are not separated well since both are between the B and V ones, while the bC and rC passbands are both a little redshifted with respect to the B and V ones. We plotted the phase shift φb − r − φr vs. the amplitude ratio Ab − r/Ar. The position of the mode f1 is very far from those of the modes f2 − f6, all clustering in a narrow region (Fig. 4). Positive values of the phase differences suggest ℓ = 0 (i.e., radial) modes, negative values are likely ℓ ≥ 1 (i.e., nonradial) modes (Watson 1988). Moreover, we can see very good agreement between the observed positions of the modes f2 − f6 and the theoretical locus of the ℓ = 2 modes (see Fig. 18 in Watson 1988). The identification of these frequencies with the ℓ = 2 modes must be considered as only preliminary, due to the uncertainties in the characteristics of the CoRoT photometric system.
The phase errorbars associated to f6 are already too large to clearly point out the mode identification, and this becomes impossible for the frequencies from f7 to f13. In particular, we cannot obtain clues on the identification of f9 as the first radial overtone.
5. The stellar physical parameters
The spectrum of CoRoT 101155310 was obtained with the HARPS instrument mounted at the 3.6-m ESO telescope on the nights of 29 − 30 June 2009. Due to the star’s faintness and the short periods, the resulting SNR value was around 30 (R = 80 000, exposure time 2300 s), and we could use the spectrum to estimate the physical parameters only.
The mean line profile was computed with the LSD software (Donati et al. 1997) and the Fourier transform of such profile supplied Veqsini = 26 ± 1 km s-1. However, this determination is affected by the broadening owing to the radial pulsation of the f1 mode. Since we do not know the amplitude of the radial velocity curve of CoRoT 101155310, we estimated it by using the 2K/ΔV value. For radial pulsation it is around 100 km s-1 mag-1 (Smith 1982; Poretti & Antonello 1988), the highest value was probably measured for V356 Aur (Poretti et al. 1987), i.e., 130 km s-1 mag-1. Since ΔV = 0.37 mag in the case of CoRoT 101155310, we got 2K = 37 km s-1 and 48 km s-1, respectively. We also estimated the 2K value in the specific case of CoRoT 101155310, obtaining 2K = 12 km s-1 using the theoretical approach described by Moya & Rodríguez-López (2010). The ephemeris determined in Sect. 3.1 allowed us to establish that the HARPS spectrum started after the maximum light and ended around the halfway point of the descending branch. In this interval the radial velocity due to pulsation is getting close to zero after its maximum value. We evaluated the effects of both the radial pulsation and the exposure time on the mean line profile by using the software package FAMIAS (Zima 2006). Our simulations indicated that the 2K values determined above could produce a maximum broadening of 5 km s-1 in the determination of the Veqsini value. By combining all these results, we accepted 23 ± 4 km s-1 as the value of the Veqsini of CoRoT 101155310.
We computed a grid of synthetic spectra with the R = 80 000 resolution and the observed line broadening by means of the ATLAS9 and SYNTHE codes (Kurucz 1993; Heiter et al. 2002). The grid covers the ranges 7000 < Teff < 8000 K, 3.2 < log g < 4.8, and −0.5 < [Fe/H] < 1.0. A microturbulent velocity of 2 km s-1 (Gray et al. 2001) was considered. We compared the observed spectra with the synthetic grid in chosen wavelength regions in order to estimate the physical parameters of the star: the Hα and Hβ wings for Teff and the Mg triplet (5167, 5173, and 5184 Å) for log g. We obtained finally  K and log g = 3.75 ± 0.20 dex. These values were then used for a complete abundance analysis (see Sect. 4.2 in Poretti et al. 2009), which revealed a slight metallic solar underabundance, i.e., [Fe/H] = −0.15 ± 0.20 dex ([Fe/H]⊙ = 7.54 dex; Asplund et al. 2009).
Identifying the fundamental radial mode allows us to calculate the absolute magnitude. We get MV = 1.46 ± 0.10 by using the period-luminosity relation given by Poretti et al. (2008). Other relations give similar results for log P = −0.900 (see Fig. 8, ibidem). The values MV = 1.46 and Teff = 7300 K puts CoRoT 101155310 in the middle of the HADS instability strip (see Fig. 2 in McNamara 2000).
The approach described by Breger & Bregman (1975) supplied the relation  (1)We know that P = 0.126 d from the CoRoT observations and that Q = 0.033 d from the identification of P as the fundamental radial mode. Since the bolometric correction is + 0.03 mag for Teff = 7300 K (Torres 2010), we obtain Mbol = 1.49 ± 0.10 and L = 19.8 ± 1.8 L⊙ from the MV = 1.46 value calculated above. The unknowns g and Teff must therefore satisfy the condition
  (2)This condition holds for the central values of log g and Teff obtained from HARPS spectra and proves the self-consistency of the physical model. We can then calculate the radius R = 2.8 ± 0.4 R⊙ and the mass M = 1.6 ± 0.7 M⊙ from the L, Teff, and log g values.
We further checked the consistency of the physical model by combining our BV photometry with the 2MASS photometry. The mean BV magnitudes are ⟨ V ⟩ = 13.37 and ⟨ B ⟩ = 13.94. These values are in good agreement with those provided by the EXODAT catalogue (V = 13.43, B − V = + 0.60; Deleuil et al. 2009). Indeed, the epoch of the EXODAT observations corresponds to the phase 0.23 p, i.e., roughly the middle of the descending branch (Fig. 3). We calculated the equivalent widths (EWs) of the NaI lines at 5890.0 and 5895.9 Å from the HARPS spectrum. We could estimate the interstellar reddening EB − V = + 0.20 by means of the EB − V − EW relationship (Munari & Zwitter 1997), also noticing that the interstellar lines are characterized by multiple components, one of which is in emission. In turn, the EV − K = + 0.56 value was calculated using the relation given by Cardelli et al. (1989), hence (V − K)0 = +0.70 from the 2MASS value K = 12.11 (Skrutskie et al. 2006). The latter index supplies a Teff value of 7250 K (Eq. (8) in Masana et al. 2006), in perfect agreement with the one provided by spectroscopy. Table 3 lists the physical parameters obtained from space-based photometry and ground-based spectroscopy.
Observed and physical parameters of CoRoT 101155310 determined in this paper.
6. Pulsational model and mode identification
The parameters obtained from CoRoT photometry and HARPS spectroscopy were used to calculate a preliminary pulsational model, making certain to match the constraint that f1 must be a radial mode. We followed the procedure and the physical assumptions described in Casas et al. (2006). In particular, we considered a variation in the convective efficiency parameter αMLT up to 1.5, of the overshoot dov up to 0.3, and an [Fe/H] metallicity in the range from –0.52 to 0.08 dex. Other effects such as diffusion and radiative forces were not included. We assumed a uniform rotation since we could not identify multiplets in advance among the 13 frequencies. A non-uniform rotation would be an additional source of uncertainty since mixed modes are highly sensitive to the rotation profile near the stellar core (Suárez et al. 2006a, 2009).
This procedure points out that a further refinement could be performed starting from M = 1.71 ± 0.02 M⊙, L = 18.5 ± 0.2 L⊙, R = 2.90 ± 0.04 R⊙, Teff = 7000 ± 50 K, log g = 3.74 ± 0.01 dex, and [Fe/H] = −0.30 ± 0.20 dex. These results indicate a cooler Teff and more pronounced metallic underabundance than those suggested by the spectroscopic analysis, though the errorbars still overlap in both cases. Models with Teff ≥ 7300 K are not able to fit f1 as the fundamental radial mode and they moreover identify the other frequencies as gravity modes. In a similar way, solar abundances lead to massive, main-sequence stars. All these possibilities are unlikely when considering the whole set of parameters and the observed photometric variability.
We should take into account that the Veqsini value suggests a non-negligible rotational velocity. The adiabatic oscillation code FILOU (Suárez 2002; Suárez & Goupil 2008, and references therein) computes the oscillation frequencies up to the second-order effects of rotation. It includes the corrections of the frequencies near degeneracy effects occurring when two frequencies are close to each other. These effects could also occur between three or more modes, but they only should be relevant for very high rotational velocities (Suárez et al. 2006b, 2010).
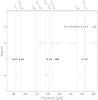 |
Fig. 5 The matching between observed (vertical lines) and calculated (points) frequencies for models with degree ℓ ≤ 3. |
Starting from the reference model pointed out by the spectroscopic and photometric data, we computed sets of models with different rotational velocities, ages, and maximum degree ℓ of the modes by using the code FILOU. We had to make some assumptions on the inclination angle i in order to constrain the rotational frequency and then infer the rotational splitting. The Veqsini value of HADS stars is usually below 25 km s-1 (Fig. 5 in Breger 2000), suggesting that these variables are intrinsically slow rotators. Thus, we considered CoRoT 101155310 as seen nearly equator-on, and we allowed variations of Veq in the range 19–30 km s-1.
The oscillation spectra predicted by the models were compared with the 13 independent terms detected in the frequency analysis. The pulsational models limited to ℓ ≤ 3 directly match 11 out of the 13 frequencies. Indeed, modes are predicted around all the observed frequencies, except for f5 and f12 (Fig. 5). To fill this gap, we computed the models with ℓ ≤ 5 and could obtain the mode identifications for these frequencies, too (Table 4). The average difference between observed and calculated frequencies is 0.28 μHz. The model depends on our assumptions and on the uncertainties in the identifications of close frequencies; therefore they cannot be considered unique. We note that identifying all frequencies at once with the modes predicted by the models with ℓ ≤ 5 improved the fit, because the oscillation spectrum would be denser. However, the high prevalence of ℓ ≥ 4 modes on ℓ ≤ 3 ones is contrary to what is expected, since the amplitudes of the modes should decrease with increasing ℓ due to the cancellation effects.
Mode identification from the best pulsational model.
The mode identification describes a star very close to the terminal age on the main sequence, with a central hydrogen content Xc = 0.15 ± 0.05 and, in turn, an age of 1485 ± 10 Myr. This evolutionary stage agrees with the identification of the additional terms (i.e., all the terms except f1) with mixed modes. The f9 mode is not identified with the first radial overtone, confirming that the f1/f9 = 0.779 value differs too much from the predicted value (0.774).
We tried a fine tuning of the model after noticing that the f3 and f4 terms are identified as two components of a rotationally split ℓ = 1 multiplet (Table 4). We considered the existence of such multiplet as a further input constraint. To do this, we computed models with small variations in the rotational velocity around the observed Veqsini. Such variations had to be large enough to modify the m ≠ 0 components sufficiently, and small enough to avoid variations in the m = 0 component. The latter constraint allows a variation of only about 4 km s-1. Within this range, the second-order effects of rotation do not change the identification of the other modes. Therefore, the model suggests that the f2 mode definitely does not belong to the same multiplet as the f3 and f4 modes.
As a last step, the non-adiabatic analysis of the mode energy balance was performed by means of the GraCo code (Moya et al. 2004; Moya & Garrido 2008). Figure 6 shows the growth range of the model. Overstable modes must have a positive growth rate, and this happens for a region including the observed frequencies.
Improvements in the theoretical treatment of the mixed modes can lead to a more accurate fitting of the oscillation spectrum of CoRoT 101155310. In any case the mixed modes can provide significant constraints on the stellar internal structure since now. In particular, our model predicts a convective core with size rc ~ 0.08 R⊙ and a thin outer convective zone located at r = 0.99 R⊙, as well as αMLT = 0.5, in agreement with Casas et al. (2006), and dov = 0.1. These two values affect not only the size of the convective zones, but also the possibility of estimating the time spent on the main sequence.
7. Discussion
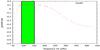 |
Fig. 6 Energy balance of the modes of the best fitting model. The green box represents where the observed modes are located in frequency. |
The CoRoT satellite offered the possibility of monitoring a variable star belonging to the class of HADS stars in a continuous and long way. At the moment, the pulsational behaviour disclosed by the timeseries of CoRoT 101155310 is the most advanced observational fact we have to understand the physical mechanisms at work in the variables of this class. These are some questions raised by previous ground-based observations on which the CoRoT photometry shed a new light.
7.1. The excitation of independent modes
The excitation of small-amplitude nonradial modes accompanying the high-amplitude radial modes in δ Sct variables has been debated at length. The pulsational content of V974 Oph provided the decisive clear piece of evidence, since this star pulsates in the fundamental radial mode (f1 = 5.23 d-1, full amplitude 0.32 mag in B) and in at least four other independent modes easily detectable also from ground-based timeseries (e.g., f2 = 5.35 d-1, full amplitude 0.14 mag in B-light; Poretti 2003). The frequency ratios f1/fi of these additional modes (0.734, 0.786, 0.807, and 0.978) clearly indicate that most of them, if not all, are nonradial modes. In the case of CoRoT 101155310 the amplitudes of the nonradial modes are much smaller than those of V974 Oph, but the superior quality of the CoRoT timeseries does not leave any ambiguity in their identification. The ratios f1/fi are listed in Table 1. The ratios 0.733, 0.811, and 0.779 are very similar to the 0.734, 0.807, and 0.786 ones obtained in the case of V974 Oph. However, the corresponding modes have a different rank in amplitude in the two solutions of the light curves of the two stars.
We can also compare the pulsational content of CoRoT 101155310 with that of HD 50844. In this low-amplitude δ Sct star, we detected an increase in the signal at f < 30 d-1 and hundreds of frequencies were necessary to reduce it to the same level of the noise observed at f > 30 d-1 (Poretti et al. 2009). After removing the peaks related to the 61 terms detected in the CoRoT data of CoRoT 101155310, the noise level is constant over the full 5 − 100 d-1 spectrum (see inserted box in panel e of Fig. 2). This noise level (29 μ mag) after subtracting 61 frequencies is much less than observed in the amplitude spectrum of HD 50844 after subtracting 500 frequencies (see Fig. 3 in Poretti et al. 2009). Moreover, the amplitude of 0.10 mmag is reached after detecting of about 250 frequencies in the light curve of HD 50844, against the only 61 ones in the case of CoRoT 101155310. We can conclude that the variability of CoRoT 101155310 is much simpler than that of HD 50844. New cases will allow us to verify if the excitation of only one ten of modes is a characteristic of the HADS stars.
7.2. The modulation of f1
The physical interpretation of the fm term is not an easy task. We could suppose that it is related with the star’s rotation, so P = 5.181 d is the rotational period. Under this assumption the radius value listed in Table 3 supplies an equatorial velocity Veq = 27 ± 4 km s-1, supporting the hypothesis that CoRoT 101155310 is seen nearly equator-on. This scenario seems coherent, but we have to explain why the rotation affects the amplitude of the main pulsation term. A chemical inhomogeneity on the surface could do it, but then it should be detected as an independent peak in the amplitude spectrum. Moreover, the fm harmonics should also be detected, since the equator-on orientation makes the continuous visibility unlikely. Actually, frequency fm is not observed in the amplitude spectrum of CoRoT 101155310. This lack could be due to both its intrinsic, very small amplitude and the instrumental effects that complicate the spectrum at f < 1 d-1.
A continuous modulation in amplitude and/or in phase superposed the main pulsational period is commonly observed in RR Lyr stars, and it defines the Blazhko effect. The onset of the Blazhko modulation is due to something more specific than rotation, e.g., the resonance model between nonradial, low-degree modes and the main radial mode (Dziembowski & Mizerski 2004), or the oblique pulsator model in which the rotational axis does not coincide with the magnetic axis (Shibahashi 2000) or the action of a turbulent convective dynamo in the lower envelope of the star (Stothers 2006). Breger (2010) discusses the possibility of explaining the amplitude and phase modulations observed in three low-amplitude δ Sct stars (FG Vir, BI CMi, and AI CVn) as due to the Blazhko effect. The very rich pulsational content of these pulsators favours the interaction between modes, without invoking the resonance mechanism suggested by Dziembowski & Mizerski (2004). In the case of HADS stars, a much smaller number of modes are excited, and then it appears more obvious to link CoRoT 101155310 with RR Lyr stars than with low-amplitude δ Sct stars, also having the sharp triplet structure in mind.
It could be useful to investigate the light curves under the magnification lens provided by the CoRoT timeseries. The long-term stability of the Blazhko modulation in RR Lyr stars is a new issue opened up by the continuous CoRoT timeseries (Poretti et al. 2010). In the case of the HADS variable CoRoT 101155310, there are very low peaks at f1 and harmonics after subtracting the 61 terms (Fig. 2, panel d), but the instrumental effects revealed by the analysis of the chromatic data can be responsible for this residual signal. The amplitudes of f1 in white light calculated in each bin are slightly varying during the CoRoT monitoring (bottom panel in Fig. 3), but this effect is very marginal and could still reflect the complicated changes in the trends of the bC, gC, and rC data. The light curves of Blazhko RR Lyr stars show bumps and larger scatter at well-defined phases (e.g., Fig. 3 in Poretti et al. 2010), probably in relation with shock waves. In the case of CoRoT 101155310, the smoothed light curve over f1 (Fig. 3, upper curve in the top panel) and the residuals folded with f1 (Fig. 3, lower curve in the top panel) do not show any particularity. Therefore, at the moment we have no further evidence supporting the straight identification of the triplets around f1 as due to the Blazhko effect observed in RR Lyr stars.
In RR Lyr stars, the amplitude of the Blazhko modulation is stronger than that of additional modes. Indeed, CoRoT photometry allowed us to study the Blazhko effect in great detail and the discovery of additional modes was a bonus (Chadid et al. 2010; Poretti et al. 2010). In the case of HADS stars, the opposite case occurred; i.e., searching for additional modes we discovered the f1 modulation. This demonstrates once more how rewarding the investment in the observation of known phenomena with more advanced tools could be.
8. Conclusions
The solution for the CoRoT light curve of CoRoT 101155310 allowed us to detect only 12 additional modes; i.e., we did not detect the huge number of frequencies found in low-amplitude pulsators (Poretti et al. 2009). These modes all have mixed nature and, together with the fundamental radial mode, originate sixty-one frequencies able to solve the CoRoT light curve. We can speculate that the large amount of energy put in the radial modes limits the number of excited nonradial modes, but the observations of new HADS stars could shed new light on this particular aspect.
The newest result is the small but very clear modulation of the fundamental radial mode, observed for the first time in an HADS star. The observation of other HADS stars by space photometry could tell us whether this is a rotational effect or an extension of the Blazhko effect from RR Lyr to HADS stars. The similarity between these two classes of variables would be a new way of looking at the Hertzsprung-Russell diagram and, if confirmed, would be able to put tighter constraints on the physical model of the Blazhko effect, also taking the thin convective layer predicted by the model of CoRoT 101155310 into account. Indeed, it should be able to explain the modulations observed both in low-mass stars in a core He-burning phase (RR Lyr stars) and in more massive, post-main sequence stars moving to the giant branch (HADS stars). In this context, nonradial resonant modes close to the radial fundamental mode seem to have the requisites needed to act in such different evolutionary stages, but the other models are still plausible. We also note that the modulation observed in CoRoT 101155310 (5.181 d) is shorter in time than the shortest ever observed for Blazhko RR Lyr stars (5.309 d in SS Cnc; Jurcsik et al. 2006).
The excitation of mixed modes in stars approaching the terminal age on the main sequence is confirmed and they are found in the predicted overstable region. Further improvements in the theoretical modelling are necessary, especially when dealing with close frequencies in the presence of a non-negligible rotation.
Acknowledgments
We acknowledge the support from the Centre National d’Études Spatiales (CNES). The spectroscopic data were obtained as part of the ESO Large Programme LP182.D-0356 (PI.: E. Poretti) in the framework of the Italian ESS project, contract ASI/INAF I/015/07/0, WP 03170. The authors wish to thank the anonymous referee for useful comments. E.N. acknowledges financial support of the NN203 302635 grant from the MNiSW. M.P., J.M.B., and Zs.B. acknowledge the support of the ESA PECS projects No. 98022 & 98114. A.M. acknowledges the funding of AstroMadrid (CAM S2009/ESP-1496). J.C.S. acknowledges support from the Instituto de Astrofísica de Andalucía (CSIC) by an Excellence Project postdoctoral fellowship financed by the Spanish Conjerería de Innovación, Ciencia y Empresa de la Junta de Andalucía under project FQM4156-2008. J.C.S. also acknowledges support by the Spanish Plan Nacional del Espacio under project ESP2007-65480-C02-01. We thank J. Vialle for checking the English form of the original manuscript. This publication makes use of data products from the Two Micron All Sky Survey, which is a joint project of the University of Massachusetts and the Infrared Processing and Analysis Center/California Institute of Technology, funded by the National Aeronautics and Space Administration and the National Science Foundation.
References
- Asplund, M., Grevesse, N., Sauval, A. J., & Scott, P. 2009, ARA&A, 47, 481 [NASA ADS] [CrossRef] [Google Scholar]
- Auvergne, M., Bodin, P., Boisnard, L., et al. 2009, A&A, 506, 411 [NASA ADS] [CrossRef] [EDP Sciences] [Google Scholar]
- Baglin, A., Auvergne, M., Barge, P., et al. 2006, in The CoRoT Mission, Pre-Launch Status, Stellar Seismology and Planet Finding, ed. M. Fridlund, A. Baglin, J. Lochard, & L. Conroy, ESA Publications Division, Nordwijk, Netherlands, ESA SP, 1036, 33 [Google Scholar]
- Barge, P., Léger, A., Ollivier, M., et al. 2006, in The CoRoT Mission, Pre-Launch Status, Stellar Seismology and Planet Finding, ed. M. Fridlund, A. Baglin, J. Lochard, & L. Conroy, ESA Publications Division, Nordwijk, Netherlands, ESA SP, 1036, 83 [Google Scholar]
- Benkő, J. M., & Csubry, Z. 2007, Acta Astron. 57, 73 [Google Scholar]
- Breger, M., 2000, Delta Scuti and Related Stars, ed. M. Breger & M. H. Montgomery, ASP Conf. Ser., 210, 3 [Google Scholar]
- Breger, M. 2010, in Variable Stars, the Galactic Halo and Galaxy Formation, ed. C. Sterken, N. Samus, & L. Szabados, Sternberg Astronomical Institute of Moscow University, Russia, 95 [Google Scholar]
- Breger, M., & Bregman, J. N. 1975, ApJ, 200, 343 [NASA ADS] [CrossRef] [Google Scholar]
- Cardelli, J. A., Clayton, G. C., & Mathis, J. S. 1989, ApJ, 345, 245 [NASA ADS] [CrossRef] [Google Scholar]
- Carpino, M., Milani, A., & Nobili, A. M. 1987, A&A, 181, 182 [NASA ADS] [Google Scholar]
- Casas, R., Suárez, J. C., Moya, A., & Garrido, R. 2006, A&A, 455, 1019 [NASA ADS] [CrossRef] [EDP Sciences] [Google Scholar]
- Chadid, M., Benkő, J. M., Szabó, R., et al. 2010, A&A, 510, A39 [NASA ADS] [CrossRef] [EDP Sciences] [Google Scholar]
- Debosscher, J., Sarro, L. M., López, et al. 2009, 506, 519 [Google Scholar]
- Deleuil, M., Meunier, J. C., Moutou, et al. 2009, AJ, 138, 649 [NASA ADS] [CrossRef] [Google Scholar]
- Donati, J.-F., Semel, M., Carter, B. D., Rees, D. E., & Collier Cameron, A. 1997, MNRAS, 291, 658 [NASA ADS] [CrossRef] [MathSciNet] [Google Scholar]
- Dziembowski, W. A., & Mizierski, T. 2004, Acta Astron., 54, 363 [NASA ADS] [CrossRef] [Google Scholar]
- Garg, A., Cook, K. H., Nikolaev, S., et al. 2010, AJ, 140, 328 [NASA ADS] [CrossRef] [Google Scholar]
- Garrido, R. 2000, in Delta Scuti and Related Stars, ed. M. Breger, & M. H. Montgomery, ASP Conf. Ser., 210, 67 [Google Scholar]
- Gray, R. O., Graham, P. W., & Hoyt, S. R., AJ, 121, 2159 [Google Scholar]
- Heiter, U., Kupka, F., van’t Veer-Menneret, C., et al. 2002, A&A, 392, 619 [NASA ADS] [CrossRef] [EDP Sciences] [Google Scholar]
- Jurcsik, J., Szeidl, B., Sódor, Á., et al. 2006, AJ, 132, 61 [NASA ADS] [CrossRef] [Google Scholar]
- Kurucz, R. 1993, CD-ROM 18 [Google Scholar]
- Masana, E., Jordi, C., & Ribas, I. 2006, A&A, 450, 735 [NASA ADS] [CrossRef] [EDP Sciences] [Google Scholar]
- McNamara, D.H. 2000, in Delta Scuti and Related Stars, ed. M. Breger, & M. H. Montgomery, ASP Conf. Ser., 210, 373 [Google Scholar]
- Moya, A., & Garrido, R. 2008, Ap&SS, 316, 129 [NASA ADS] [CrossRef] [Google Scholar]
- Moya, A., & Rodríguez-López, C. 2010, ApJ, 710, 7 [Google Scholar]
- Moya, A., Garrido, R., & Dupret, M. A. 2004, A&A, 414, 1081 [NASA ADS] [CrossRef] [EDP Sciences] [Google Scholar]
- Montgomery, M. H., & O’Donoghue, D. 1999, Delta Scuti Star Newsletter, 13, 28 [NASA ADS] [Google Scholar]
- Munari, U., & Zwitter, T. 1997, A&A, 318, 269 [NASA ADS] [Google Scholar]
- Pojmanski, G. 2000, Acta Astron., 50, 977 [Google Scholar]
- Poretti, E. 2001, A&A, 371, 986 [NASA ADS] [CrossRef] [EDP Sciences] [Google Scholar]
- Poretti, E. 2003, A&A, 409, 1031 [NASA ADS] [CrossRef] [EDP Sciences] [Google Scholar]
- Poretti, E., & Antonello, E. 1988, A&A, 199, 191 [NASA ADS] [Google Scholar]
- Poretti, E., Antonello, E., & Mantegazza, L. 1987, A&A, 181, 273 [NASA ADS] [Google Scholar]
- Poretti, E., Suárez, J. C., Niarchos, P. G., et al. 2005, A&A, 440, 1097 [NASA ADS] [CrossRef] [EDP Sciences] [Google Scholar]
- Poretti, E., Clementini, G., Held, E., et al. 2008, ApJ, 685, 947 [NASA ADS] [CrossRef] [Google Scholar]
- Poretti, E., Michel, E., Garrido, R., et al. 2009, A&A, 506, 85 [NASA ADS] [CrossRef] [EDP Sciences] [Google Scholar]
- Poretti, E., Paparó, M., Deleuil, M., et al. 2010, A&A, 520, A108 [NASA ADS] [CrossRef] [EDP Sciences] [Google Scholar]
- Shibahashi, H. 2000, in The Impact of Large-Scale Surveys on Pulsating Star Research, ed. L. Szabados, & D. Kurtz, ASP Conf. Ser., 203, 299 [Google Scholar]
- Skrutskie, M. F., Cutri, R. M., Stiening, R., et al. 2006, AJ, 131, 1163 [NASA ADS] [CrossRef] [Google Scholar]
- Smith, M. A. 1982, ApJ, 254, 242 [NASA ADS] [CrossRef] [Google Scholar]
- Stothers, R. B. 2006, ApJ, 652, 643 [NASA ADS] [CrossRef] [Google Scholar]
- Suárez, J. C. 2002, Ph.D. Thesis, ISBN 84-689-3851-3, ID 02/PA07/7178 [Google Scholar]
- Suárez, J. C., & Goupil, M. J. 2008, Ap&SS, 316, 155 [NASA ADS] [CrossRef] [Google Scholar]
- Suárez, J. C., Goupil, M. J., & Garrido, R. 2006a, A&A, 447, 649 [NASA ADS] [CrossRef] [EDP Sciences] [Google Scholar]
- Suárez, J. C., Goupil, M. J., & Morel, P. 2006b, A&A, 449, 673 [NASA ADS] [CrossRef] [EDP Sciences] [Google Scholar]
- Suárez, J. C., Garrido, R., & Moya, A. 2007, A&A, 474, 961 [NASA ADS] [CrossRef] [EDP Sciences] [Google Scholar]
- Suárez, J. C., Goupil, M. J., Reese, D. R., et al. 2010, ApJ, 721, 537 [NASA ADS] [CrossRef] [Google Scholar]
- Suárez, J. C., Moya, A., Amado, P. J., et al. 2009, ApJ, 690, 1401 [NASA ADS] [CrossRef] [Google Scholar]
- Torres, G. 2010, AJ, 140, 1158 [NASA ADS] [CrossRef] [Google Scholar]
- Vaniček, P. 1971, Ap&SS, 12, 10 [NASA ADS] [CrossRef] [Google Scholar]
- Watson, R. D. 1988, Ap&SS, 140, 225 [Google Scholar]
- Weiss, W. W. 2006, in The CoRoT Mission, Pre-Launch Status, Stellar Seismology and Planet Finding, ed. M. Fridlund, A. Baglin, J. Lochard, & L. Conroy, ESA Publications Division, Nordwijk, Netherlands, ESA SP, 1036, 93 [Google Scholar]
- Zima, W. 2006, A&A, 455, 227 [NASA ADS] [CrossRef] [EDP Sciences] [Google Scholar]
All Tables
Identification, frequencies, Fourier amplitudes, and phases (T0 = HJD 2 454 236.7502) of the terms detected in the data of CoRoT 101155310 (22 270 datapoints).
All Figures
|
Fig. 1 Top panel: curve of the residuals (a preliminary solution was subtracted from the original data) showing the long- and short-term instrumental effects. Middle panel: behaviour of the mean magnitudes before (upper curve) and after (lower curve) the removal of the instrumental effects shown in the upper panel. Each bin spans four pulsational cycles. Bottom panel: the example extracted from the final timeseries of CoRoT 101155310 shows the continuous monitoring obtained from space by CoRoT. |
| In the text | |
|
Fig. 2 Subsequent steps in the detection of frequencies in the amplitude spectra of CoRoT 101155310. |
| In the text | |
|
Fig. 3 Top panel: the CoRoT data folded with the main pulsational frequency f1 (upper curve) and the residuals after prewhitening of the 61 frequencies (lower curve). Bottom panel: amplitudes of the f1 term calculated from measurements spanning four consecutive pulsational cycles. |
| In the text | |
|
Fig. 4 Phase shifts and amplitude ratios of the frequencies from f1 to f6 as obtained from CoRoT coloured timeseries. |
| In the text | |
|
Fig. 5 The matching between observed (vertical lines) and calculated (points) frequencies for models with degree ℓ ≤ 3. |
| In the text | |
|
Fig. 6 Energy balance of the modes of the best fitting model. The green box represents where the observed modes are located in frequency. |
| In the text | |
Current usage metrics show cumulative count of Article Views (full-text article views including HTML views, PDF and ePub downloads, according to the available data) and Abstracts Views on Vision4Press platform.
Data correspond to usage on the plateform after 2015. The current usage metrics is available 48-96 hours after online publication and is updated daily on week days.
Initial download of the metrics may take a while.