Free Access
Fig. 3
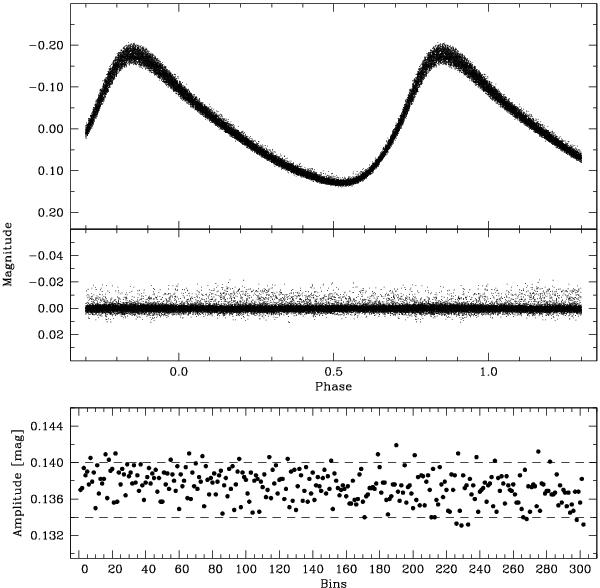
Top panel: the CoRoT data folded with the main pulsational frequency f1 (upper curve) and the residuals after prewhitening of the 61 frequencies (lower curve). Bottom panel: amplitudes of the f1 term calculated from measurements spanning four consecutive pulsational cycles.
Current usage metrics show cumulative count of Article Views (full-text article views including HTML views, PDF and ePub downloads, according to the available data) and Abstracts Views on Vision4Press platform.
Data correspond to usage on the plateform after 2015. The current usage metrics is available 48-96 hours after online publication and is updated daily on week days.
Initial download of the metrics may take a while.