Fig. 5
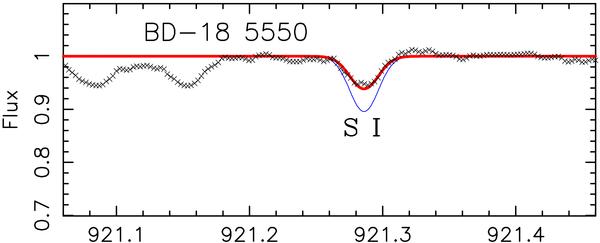
Spectrum of BD–18 5550 in the region of Mult. 1 of S I. Only the main line can be measured in our spectrum, as the others are severely blended with telluric lines. The thick line shows the theoretical profile computed with our value of the S abundance (Table 3). The profile computed with the abundance adopted by Takeda & Takada-Hidai (2011) (thin line), is not compatible with the observed spectrum.
Current usage metrics show cumulative count of Article Views (full-text article views including HTML views, PDF and ePub downloads, according to the available data) and Abstracts Views on Vision4Press platform.
Data correspond to usage on the plateform after 2015. The current usage metrics is available 48-96 hours after online publication and is updated daily on week days.
Initial download of the metrics may take a while.