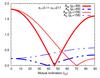
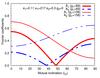
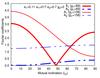
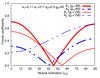
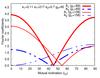
Fig. 4

Left panels: the dependence on the mutual inclination
(im) of the amplitudes Aℳ,
 for CoRoT-9b, for g1 = 69° and
g1 = 158°. For other g1
values the corresponding curves run within the area limited by these lines. (The two
left panels are identical.) Middle and right panels: the
corresponding A1,2 amplitudes of the trigonometric
representation (Eq. (32)) of the
O−C for two different outer eccentricities e2 = 0.3
(middle) and e2 = 0.7
(right); and outer dynamical (relative) argument of pericentrum
arguments g2 = 0° (up) and
g2 = 90° (down). For the sake of
clarity, we did not plot the small A3 coefficients. (For
e2 = 0.0 the
amplitudes of the two identical left panels are equal to
A2, while
A1 = A3 = 0.)
for CoRoT-9b, for g1 = 69° and
g1 = 158°. For other g1
values the corresponding curves run within the area limited by these lines. (The two
left panels are identical.) Middle and right panels: the
corresponding A1,2 amplitudes of the trigonometric
representation (Eq. (32)) of the
O−C for two different outer eccentricities e2 = 0.3
(middle) and e2 = 0.7
(right); and outer dynamical (relative) argument of pericentrum
arguments g2 = 0° (up) and
g2 = 90° (down). For the sake of
clarity, we did not plot the small A3 coefficients. (For
e2 = 0.0 the
amplitudes of the two identical left panels are equal to
A2, while
A1 = A3 = 0.)

Current usage metrics show cumulative count of Article Views (full-text article views including HTML views, PDF and ePub downloads, according to the available data) and Abstracts Views on Vision4Press platform.
Data correspond to usage on the plateform after 2015. The current usage metrics is available 48-96 hours after online publication and is updated daily on week days.
Initial download of the metrics may take a while.