Fig. 3
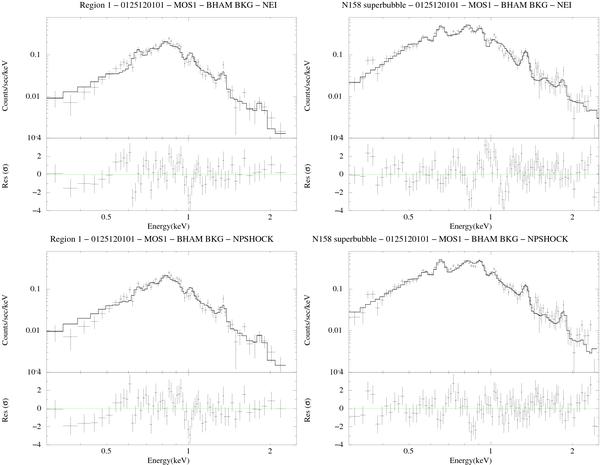
Spectra of the diffuse emission in the field of view of PSR B 0540−69 extracted from the XMM-Newton EPIC MOS1 data of the Obs. ID 01251201. The left panels show the spectra of region 1 located east of the PSR, the right panels show the spectra of the superbubble in the H ii region N 158. The upper diagrams show the fit with the NEI model, the lower diagrams with the NPSHOCK model.
Current usage metrics show cumulative count of Article Views (full-text article views including HTML views, PDF and ePub downloads, according to the available data) and Abstracts Views on Vision4Press platform.
Data correspond to usage on the plateform after 2015. The current usage metrics is available 48-96 hours after online publication and is updated daily on week days.
Initial download of the metrics may take a while.