| Issue |
A&A
Volume 528, April 2011
|
|
|---|---|---|
| Article Number | A19 | |
| Number of page(s) | 14 | |
| Section | Extragalactic astronomy | |
| DOI | https://doi.org/10.1051/0004-6361/201015635 | |
| Published online | 18 February 2011 | |
Nature vs. nurture in the low-density environment: structure and evolution of early-type dwarf galaxies in poor groups⋆
1
INAF – Osservatorio Astronomico di Padova, Vicolo dell’Osservatorio
5,
35122
Padova,
Italy
e-mail: This email address is being protected from spambots. You need JavaScript enabled to view it.
; This email address is being protected from spambots. You need JavaScript enabled to view it.
; This email address is being protected from spambots. You need JavaScript enabled to view it.
;
2
School of Physics & Astronomy, University of
Nottingham, University
Park, NG7 2RD,
UK
e-mail: This email address is being protected from spambots. You need JavaScript enabled to view it.
3
Institut für Astronomie der Universität Wien,
Türkenschanzstraße
17, 1180
Wien,
Austria
e-mail: This email address is being protected from spambots. You need JavaScript enabled to view it.
4
SISSA/ISAS, via Beirut 2-4, 34151
Trieste,
Italy
5
INAOE, Luis Enrique Erro 1, 72840
Tonantzintla, Puebla, Mexico
Received:
24
August
2010
Accepted:
22
November
2010
Abstract
We present the stellar population properties of 13 dwarf galaxies residing in poor groups (low-density environment, LDE) observed with VIMOS at VLT. Ages, metallicities, and [α/Fe] ratios were derived within an r < re/2 aperture from the Lick indices Hβ, Mgb, Fe5270, and Fe5335 through comparison with our simple stellar population (SSP) models that account for variable [α/Fe] ratios. For a fiducial subsample of 10 early-type dwarfs, we derived median values and scatters around the medians of 5.7 ± 4.4 Gyr, −0.26 ± 0.28, and −0.04 ± 0.33 for age, log Z/Z⊙, and [α/Fe] , respectively. For a selection of bright early-type galaxies (ETGs) from an earlier sample residing in a comparable environment, we derive median values of 9.8 ± 4.1 Gyr, 0.06 ± 0.16, and 0.18 ± 0.13 for the same stellar population parameters. It follows that dwarfs are on average younger, less metal rich, and less enhanced in the α-elements than giants, in agreement with the extrapolation to the low-mass regime of the scaling relations derived for giant ETGs. From the total (dwarf + giant) sample, we find that age ∝ σ0.39 ± 0.22, Z ∝ σ0.80 ± 0.16, and α/Fe ∝ σ0.42 ± 0.22. We also find correlations with morphology, in the sense that the metallicity and the [α/Fe] ratio increase with the Sersic index n or with the bulge-to-total light fraction B/T. The presence of a strong morphology-[α/Fe] relation appears to contradict the possible evolution along the Hubble sequence from low B/T (low n) to high B/T (high n) galaxies. We also investigate the role played by environment by comparing the properties of our LDE dwarfs with those of Coma red passive dwarfs from the literature. We find possible evidence that LDE dwarfs experienced more prolonged star formations than Coma dwarfs, however larger data samples are needed to draw firmer conclusions.
Key words: galaxies: elliptical and lenticular, cD / galaxies: ISM / galaxies: fundamental parameters / galaxies: abundances / galaxies: dwarf / galaxies: evolution
Based on observations obtained at the European Southern Observatory, La Silla, Chile.
© ESO, 2011
1. Introduction
According to the widely accepted Λ cold dark matter (ΛCDM) scenario for structure formation, dwarf-size dark matter haloes are the first to form, while higher mass haloes build up later through a continuous “hierarchical” merging of smaller haloes (e.g., White & Rees 1978; Kauffmann 1996). In this scenario, dwarf galaxies should be the first systems to form. However, there is strong observational evidence, both in the nearby (Bressan et al. 1996; Thomas et al. 2005; Clemens et al. 2006; Clemens et al. 2009) and more distant Universe (e.g., Cimatti et al. 2006; Fontana et al. 2006), that massive early-type galaxies (ETGs) were the first to complete the star formation process and that star formation terminated later in lower mass systems. This “anti-hierarchical” behaviour of the stellar populations as opposed to the hierarchical behaviour of the dark matter is commonly referred to as “downsizing”. It has been shown that downsizing in star formation can be reconciled with the ΛCDM paradigm provided that a suitable mechanism (e.g., AGN feedback) is found to quench star formation at earlier times in more massive ETGs (e.g., Granato et al. 2004; De Lucia et al. 2006). Supernova heating is also increasingly effective with decreasing binding energy (decreasing galaxy halo mass) in slowing down the star formation and making the chemical enrichment less efficient (Granato et al. 2004). This can explain the observed correlations between the average age, metallicity, and [α/Fe] ratio, derived through integrated colours, indices, and spectral energy distribution (SED) fitting, and the galaxy velocity dispersion in ETGs (e.g., Nelan et al. 2005; Thomas et al. 2005; Denicoló et al. 2005; Gallazzi et al. 2005; Clemens et al 2006; Annibali et al. 2007; Reda et al. 2007).
Another issue is the role played by environment on galaxy evolution. The influence of environment is confirmed by the presence of the well-known morphology-density relation, according to which early-type and morphologically undisturbed galaxies are preferentially located in high-density environments (e.g., Oemler 1974; Dressler et al. 1997; Bamford et al. 2009), and of the star-formation density relation (e.g., Lewis et al. 2002; Gómez et al. 2003; Haines et al. 2007). This agrees with the ΛCDM paradigm, where present-day clusters of galaxies form from the highest peaks in the primordial density fields, leading to an earlier onset of the collapse of the dark matter haloes and to more rapid mergers (e.g., Kauffmann 1995). On the other hand, studies of the stellar populations in ETGs (via absorption-line indices or the fundamental plane) provide discrepant results. Some of them reveal a significant dependence of the stellar population properties on the local density (e.g., Longhetti et al. 2000; Poggianti et al. 2001; Kuntschner et al. 2002; Proctor et al. 2004; Thomas et al. 2005; Clemens et al. 2006; Sánchez-Blázquez et al. 2006; Annibali et al. 2007; Gobat et al. 2008; La Barbera et al. 2010; Rettura et al. 2010), with ETGs in the field being 1–3 Gyr younger than in the cluster. Others claim no significant difference between the field and the cluster (van Dokkum & van der Marel 2007; di Serego Alighieri et al. 2006; Pannella et al. 2009; Thomas et al. 2010).
The effect of environment on galaxy evolution is expected to be stronger for dwarf galaxies because of their lower mass. Low-mass galaxies are more susceptible to environmental effects owing to their shallow potential well that facilitates the removal of gas from the galaxies. Hydrodynamical simulations show that, while for massive galaxies ram-pressure stripping is only effective in the cores of rich clusters, dwarf galaxies can be completely stripped of their gas even in poor groups (e.g., Bekki et al. 2001; Bekki et al. 2002; Marcolini et al. 2003). Suffocation, ram-pressure stripping, and galaxy harassment can deprive dwarf galaxies of their gas reservoir, quenching star formation and transforming them into passive dwarf ellipticals. They can suffer from tidal truncation (e.g., Rubin et al. 1988) or tidal disruption (e.g., Oh et al. 1995) during their orbit through a more massive dark matter halo, like a group or cluster of galaxies. Indeed, studies of the environmental influence on galaxy properties have found that the correlations between colour or star formation rate (SFR) and local galaxy density are the strongest for low-mass galaxies (Kauffmann et al. 2004; Tasca et al. 2009; Grützbauch et al. 2010). Similarly, the morphology-density relation is very strong for low-mass galaxies (e.g., Binggeli et al. 1990). It has also been found that the bulk of dwarf galaxies in galaxy groups and clusters are passively evolving, while, as the local density decreases, the fraction of passively evolving dwarfs drops rapidly, reaching zero in the rarefied field (e.g., Haines et al. 2007).
Characterizing the stellar populations of dwarf galaxies in different environments is fundamental to test the predictions of galaxy formation models. Studies based on absorption line-strength indices were mainly preformed for early-type dwarfs in the Virgo (Gorgas et al. 1997; Geha et al. 2003; van Zee et al. 2004; Michielsen et al. 2008; Paudel et al 2010; Spolaor et al. 2010), Fornax (Held & Mould 1994; Spolaor et al. 2010) and Coma (Poggianti et al. 2001; Smith et al. 2009; Matković et al. 2009) clusters. These works revealed a dependence of the stellar population properties on the distance from the cluster centre, testifying a strong environmental effect on the evolution of the stellar populations. The first (and to date unique) comparison between cluster and field dwarf ETGs was performed by Michielsen et al. (2008), who however found no clear difference between the two environments. An analysis of a sample of dwarf ellipticals by Koleva et al. (2009) revealed a complex star formation history similar to what is observed in dwarf spheroidals of the Local Group. Group and cluster galaxies have similar radial metallicity gradients and star formation histories.
Here we address the problem of the role played by internal galaxy properties and environment (nature versus nurture) on the evolution of early-type dwarf systems. Our dwarf galaxies are members of four poor galaxy groups (low-density environment, LDE) studied in Grützbauch et al. (2007) and Grützbauch et al. (2009) and span a wide range of internal properties like luminosity, morphology (Sersic index and bulge fraction), and internal velocity dispersion. We investigate the relationship between the stellar population parameters and internal galaxy properties such as morphology and velocity dispersion, as well as with local galaxy density, and compare our sample with Coma dwarfs from the literature.
The paper is structured as follows. The dwarf galaxy sample is described in Sect. 2 and the method of deriving the stellar population parameters in Sect. 3. We investigate correlations of age, metallicity, and [α/Fe] ratio with internal galaxy properties, such as velocity dispersion and morphology, in Sect. 4, and with environment in Sect. 5. Our results are summarized and discussed in Sect. 6.
Dynamical properties of the four groups.
Basis properties of the sample.
2. The sample
2.1. Sample selection
The dwarf galaxy sample studied here is fully described in Grützbauch et al. (2007) and Grützbauch et al. (2009). All galaxies are members of poor galaxy groups dominated by a bright galaxy pair composed of an elliptical (E) and a spiral (S). The pairs were initially selected from the catalogue of isolated galaxy pairs of Reduzzi & Rampazzo (1995), who catalogue them as RR 143, RR 210, RR 216, and RR 242. An X-ray study of the 4 pairs (Grützbauch et al. 2007) show that their X-ray properties are very different in contrast to their similar optical characteristics (see also Trinchieri & Rampazzo 2001). RR 143 and RR 242 show extended diffuse X-ray emission, indicative of the presence of a hot intra group medium (IGM), while RR 210 and RR 216 are X-ray underluminous, with no evidence of an IGM. Their diverse X-ray luminosities, LX/LB ratios and X-ray morphologies suggest that they have different origins or that they might be in different evolutionary stages.
Each bright galaxy pair is surrounded by a small number of less-luminous galaxies forming loose groups and ranging from 4 group members in the poorest group RR 143, to 16 in RR 242, down to an absolute magnitude of MR ~ −15 (Grützbauch et al. 2009). Those additional group members were detected in a 34′ × 34′ field of view, corresponding to about 500 × 500 kpc at the pairs’ distance. The faint group members were observed with VIMOS, the VIsible Multi-Object Spectrograph (Le Fèvre et al. 2003) at the Very Large Telescope (VLT). The observations and data reduction are described as well in Grützbauch et al. (2009).
Table 1 gives the basic kinematical and dynamical properties of the four groups, calculated with galaxies within a 0.5 Mpc radius and velocity interval of Δvrad = ± 1000 km s-1 from the central E+S galaxy pair in each group. The calculation of all quantities is fully described in Grützbauch et al. (2009). The columns are group ID (1); number of group members (2), including the faint galaxies used in this study, plus additional spectroscopically confirmed members within r = 0.5 Mpc not studied here; group distance (3) in Mpc and distance modulus; coordinates (4 and 5); group radial velocity (6); the group velocity dispersion (7); virial radius (8); crossing time (9); virial mass (10); group luminosity (11) and mass-to-light ratio of the group (12). The group richness ranges from 5 (RR 143) to 23 (RR 210) members within 0.5 Mpc, and is not correlated with the presence of an X-ray emitting, hot IGM. The group masses range from 6 × 10¹² to 2 × 10¹³ M⊙.
The morphological types of the group faint members considered in this study are given in Col. 2 of Table 2. The majority of the galaxies are classified as early-type (S0 or dE). Only two galaxies out of 17 are classified as spirals. For RR242_25575 the classification is not clear because of a warped structure, but it has a strong bulge and intermediate Sersic index, indicative of early-type morphology. We therefore included this galaxy in the early-type sample. MR is in the range − 19.8– − 14.8 mag.
2.2. Spectroscopic observations
To obtain line-strength indices for the most prominent Balmer and metal absorption lines in the blue range of the spectrum, we used the high-resolution blue grism. This grism permits the coverage of the spectral region containing the Hβ, Mg2, and Fe (λ 5270 Å, λ 5335 Å) absorption lines with a resolution of R = 2050 (1′′ slit) and a dispersion of 0.51 Å pixel-1. Spectrophotometric and Lick standard stars were either observed or extracted from the VIMOS data archive with the same instrument set-up. This configuration allows only one slit in the dispersion direction; i.e., each single spectrum covers the full length of the detector. The wavelength interval depends on the slit position. At the CCD centre, the wavelength interval is 4150–6200 Å. At the upper CCD edge (+4′), the interval is 4800–6900 Å, and 3650–5650 Å at the lower edge (−4′). The total integration time per object was 3600 s.
Standard data reduction was performed with the ESO data reduction pipeline using the recipes especially developed for VIMOS, yielding bias-corrected, wavelength-calibrated, and sky-subtracted 2D spectra of each object. For the redshift measurements, the 1D spectra were extracted from the full spatial extent of the galaxy, adding up the signal over the whole 2D spectrum. For the measurement of line-strength indices, however, it is important that the same area relative to a galaxy’s size is sampled in each object to avoid biasing the resulting ages and metallicities. Since radial age and metallicity gradients are commonly detected in ETGs and spheroids, sampling different radial extents, e.g. because of instrumental constraints, can introduce a systematic bias. Due to the overall faintness and low signal-to-noise ratios of our sample, we chose to extract the spectra from a relatively large aperture of radius re/2. The effective radii were measured with the GALFIT package (Peng 2002) by fitting a single Sersic model to the galaxy image, as described in Grützbauch et al. (2007). The 2D spectra were extracted by adding up the pixel rows across the spatial direction that are within ± re/2 from the peak of the light distribution (i.e. the galaxy centre).
2.3. Galaxy velocity dispersions
The stellar velocity dispersions were measured from the 1D extracted spectra with the penalized pixel-fitting (pPXF) code of Cappellari & Emsellem (2004) parametrizing the line-of-sight velocity distribution (LOSVD) as a sum of orthogonal functions in a Gauss-Hermite series. Spectral regions contaminated by emission lines were masked in the galaxy spectra. The velocity dispersion was derived by a linear combination of appropriately convolved template star spectra, which reproduces the galaxy spectrum best. The advantage of this method is that errors due to template-mismatch are reduced by using a combination of template stars. The template star collection comprised 1388 stars from the ELODIE library (Prugniel & Soubiran 2001). The resulting values, together with their formal errors, are given for each galaxy in Table 2.
2.4. Bulge fractions and Sersic indices
We use two quantities to describe the galaxy’s morphology and structure: (1) the bulge fraction, B/T, and (2) the Sersic index n, where B/T is the ratio between the luminosity of the bulge component and the total light of the galaxy. This ratio was measured with GALFIT. The method is fully described in Grützbauch et al. (2009). A disk and a bulge component are fitted to the galaxy image simultaneously by an exponential and a Sersic model, respectively. The bulge luminosity is then divided by the sum of the luminosities of bulge and disk components, i.e. the total galaxy light. The Sersic index n was measured by Grützbauch et al. (2007) and is obtained by fitting a single Sersic model to the whole galaxy. The Sersic index n determines the shape of the radial light profile and is found to correlate with the galaxy luminosity or mass (e.g., Trujillo et al. 2004). More massive galaxies tend to be more centrally concentrated, showing higher n. Furthermore, bulge-dominated galaxies typically have n > 2, where n = 4 corresponds to the de Vaucouleurs profile, which was found to be valid for many massive ellipticals. The presence of a disk leads to smaller n, since the light profile of a disk decreases exponentially with radius, meaning n = 1. We do not use the Sersic index of the bulge obtained by the bulge-disk decomposition, since we are interested in possible variations in the stellar population parameters with the structure of the entire galaxy. The effective radius from the same single Sersic fit is used to determine the aperture size re/2, from which the spectra are extracted, and within which the galaxy’s velocity dispersion is measured (see previous section). We provide in Cols. 5–7 of Table 2 the effective radius re, the bulge fraction B/T, and the Sersic index n, respectively. The errors on B/T were obtained from the magnitude errors of the bulge and disk components provided by GALFIT. These formal errors could underestimate the real errors. In fact, Grützbauch et al. (2009) show that there is an average difference of ~0.1 in the calculated B/T if one fits the bulge with a de Vaucouleur or with a Sersic profile. The real errors are more likely close to this value. The errors on the Sersic index n are those given by GALFIT; however simulations performed with artificial galaxies provide slightly higher errors (e.g., Häussler et al. 2007).
2.5. Local galaxy density
We use two quantities to describe the environment in which our dwarf galaxies reside: the volume density ρxyz and the local surface density Σ3. The density ρxyz was calculated according to the definition of Tully (1988a) as the density of galaxies brighter than MB = −16 mag. The density was determined in a cube of 1 Mpc3 around the group’s barycentre. Using velocity-based distances, the contributions of the individual galaxies were summed up in order to derive the local density for each group which are 0.09, 1.21, 0.81, and 0.72 galaxies Mpc-3 for RR43, RR 219, RR 216, and RR 242, respectively. The values reported in Col. 8 of Table 2 for the invidual galaxies reflect the local density at the position of the galaxy. The computation of ρxyz includes a correction for incompleteness based on the predictions by the normalized Schechter (1976) luminosity function. A detailed discussion about possible errors on ρxyz is given in Tully (1988b). Because of the adopted 1 Mpc scale, the ρxyz values are large-scale densities, describing the global properties of the group, and this explains why the values are quite similar within the same group. These densities are useful for comparison between different large environments like the field and the cluster environment. However, they do not describe environmental differences within the same group.
A more local measure of the density is provided by the surface density
Σ3, which is based on the distance to the third nearest neighbour. We
considered all spectroscopically confirmed group members, including the brighter galaxies
that are not studied here. For a list of group members found around each galaxy pair, see
Table A.1 in Grützbauch et al. (2009). The third
nearest neighbour density, Σ3, is computed by dividing the number of galaxies,
in this case N = 3, by the area over which they are distributed, i.e. the
area of a circle of radius D3, where
D3 is the distance to the third nearest neighbour:
 . D3
is measured in Mpc, which gives Σ3 as a surface density in Mpc-2.
The use of the distance to the third nearest neighbour can lead to relatively high values
of galaxies per Mpc2, since it is sensitive to very local galaxy concentrations
and is not comparable to measurements of the large-scale galaxy density, such as
ρxyz. These very local galaxy
concentrations, however, can have a significant influence on the stellar populations of
galaxies through galaxy interactions and merging. The derived Σ3 are given in
Col. 9 of Table 2. We have not computed individual
errors on Σ3, since the uncertainty is dominated by projection effects, which
we are not able to account for with the present data.
. D3
is measured in Mpc, which gives Σ3 as a surface density in Mpc-2.
The use of the distance to the third nearest neighbour can lead to relatively high values
of galaxies per Mpc2, since it is sensitive to very local galaxy concentrations
and is not comparable to measurements of the large-scale galaxy density, such as
ρxyz. These very local galaxy
concentrations, however, can have a significant influence on the stellar populations of
galaxies through galaxy interactions and merging. The derived Σ3 are given in
Col. 9 of Table 2. We have not computed individual
errors on Σ3, since the uncertainty is dominated by projection effects, which
we are not able to account for with the present data.
It can be seen that Σ3 can vary significantly within the same group. These values will be used in Sect. 5.1 to investigate the effect of local environment on the evolution of the dwarf galaxy stellar populations.
3. Derivation of the stellar population parameters
3.1. Lick Indices
Lick indices (Worthey et al. 1994) were computed following the procedure described in Rampazzo et al. (2005). The VIMOS HR spectra extracted within the central r < re/2 aperture were first degraded to match the wavelength-dependent resolution of the Lick-IDS system (FWHM ~ 8.4 Å at 5400 Å, Worthey & Ottaviani 1997) by convolution with a Gaussian kernel of variable width. Then the indices were computed on the degraded galaxy spectra using the refined passband definitions of Trager et al. (1998). Only in few cases does the covered spectral range allow sampling of Hγ and Hδ. For sake of homogeneity within the sample, we did not consider these features and used only Hβ as a Balmer line. The “raw” indices were calibrated into the Lick-IDS system by performing, in the following order, the following steps: correction for velocity dispersion, correction of Hβ for possible emission, calibration through Lick-IDS standard stars.
In the first step, we convolved the spectra of two K0 III stars (HD 073665 and HD 073710), belonging to the Lick star dataset observed along with the galaxies, with Gaussian kernels of variable widths, to simulate the effect of galaxy velocity dispersion on the indices. Lick indices were computed on the smoothed stellar spectra to derive the fractional index variation Rσ = (EWσ − EW0)/EW0 as a function of σ, where EWσ is the index strength at a velocity dispersion of σ, and EW0 the index strength at zero velocity dispersion. It is easy to demonstrate that the zero-velocity galaxy index can be computed as EW0σ = EWold/(1 + Rσ), where Rσ = is derived for each galaxy of given σ.
[OIII] emissions for the sample.
Since our spectra do not extend up to the Hα wavelengths, the emission correction to the Hβ index was performed via the [OIII]λ5007 line. This is not optimal because the Hβ/[OIII] ratio as measured in samples of ETGs presents a large scatter. Trager et al. (2000) found that the Hβ/[OIII] ratio varies from 0.33 to 1.25, with a median value of 0.6, while from the results of Annibali et al. (2010) we derive (excluding the Seyferts from the sample) a median value of 0.75 with a dispersion of 0.37. We computed the emission correction to Hβ to be ΔEWHβ = (0.75 ± 0.37)EW [OIII] . The [OIII] emissions, which are listed in Table 3, were derived by subtracting simple stellar population models to the galaxy observed spectra and by fitting the emission lines in the residual spectra with Gaussians of variable width, as fully described in Annibali et al. (2010). Only for two galaxies, RR210_11372 and RR242_8064, could a satisfactory fit not be derived. Goudfrooij & Emsellem (1996) provide a correction to the Mgb index from the contamination of the [NI] emission line doublet at 5199 Å. The [NI]5199 is very faint compared to the other lines, and difficult to measure in our spectra. In the two galaxies with the strongest emission lines, RR242_23187 and RR143_24246, we derived EW [NI] /EW [OIII] ~ 0.01 and 0.03 respectively. This is significantly lower than the median value of ~0.2 obtained from Table 1 of Goudfrooij & Emsellem (1996), assuming the same continuum at 5007 Å and 5199 Å, and could reflect the fact that dwarfs have lower metallicities than giant ellipticals. According to our results, the contamination from the [NI]5199 doublet to the Mgb index is negligible.
Finally, we calibrated our indices into the Lick-IDS system through Lick standard stars, following the prescription by Worthey & Ottaviani (1997). Five Lick stars (HD 050778, HD 073665, HD 073710, HD 122563, and HD 136028) were observed with the galaxies. The stellar spectra were degraded to match the Lick resolution, and the indices were measured following the same procedure as for the galaxies. Then, our measurements were compared with the values provided by Worthey et al. (1994) for the standard stars, and a linear transformation in the form EWLick = α × EWus + β was derived through a least square fit. This transformation was used to calibrate all the galaxy indices into the Lick-IDS system.
The errors on the indices were determined through the following procedure. Starting from each real galaxy spectrum, we generated 1000 random modifications by adding a wavelength dependent Poissonian fluctuation from the corresponding spectral noise σ(λ). For each “perturbed” spectrum, we then repeated the index computation procedure and derived the standard deviation. The rms of the linear transformation into the Lick system was added in quadrature to the Poissonian error; for the Hβ index, we also added the error associated with the emission correction.
We provide in Table 4 the most important indices (Hβ, Mgb, Fe5270, Fe5335) for the individual galaxies. These indices are used in Sect. 3.2 to infer the stellar population parameters. We excluded the galaxies with very strong emission lines (RR143_24246 and RR242_23187) and with a very noisy spectrum (RR210_11372). We ended up with a sample of 14 galaxies. For RR242_13326, we do not provide the Fe5335 index, which is contaminated by a residual sky subtraction feature.
Lick indices.
3.2. Ages, metallicities, and α/Fe ratios
To derive the stellar population parameters, we used the simple stellar population (SSP) models presented in Annibali et al. (2007), (hereafter A07). Here we extended the models down to [α/Fe] = −0.8 to account for the chemical compositions of dwarf galaxies1. We briefly recall that the SSPs are based on the Padova library of stellar models (Bressan et al. 1994) and accompanying isochrones (Bertelli et al. 1994). Computation of the synthetic indices is based on the fitting functions (FFs) of Worthey et al. (1994) and of Worthey & Ottaviani (1997) for the higher order Balmer lines. The departure from solar-scaled compositions is accounted for through the index responses of Korn et al. (2005). As fully described in A07, we assign N, O, Ne, Na, Mg, Si, S, Ca, and Ti to the αgroup, and Cr, Mn, Fe, Co, Ni, Cu, and Zn to the Fe-peak group. For simplicity, we assume in these models that the elements are enhanced/depressed by the same factor within each group, even if it has been shown that they exhibit different trends with [Fe/H] (e.g., Fulbright et al. 2007). While the α and Fe-peak groups are respectively enhanced and depressed in the [α/Fe] > 0 models, the opposite holds for the [α/Fe] < 0 models. The effect of departure from solar-scaled compositions on the stellar evolutionary tracks is not included in these models.
Derived stellar population parameters.
As shown by several authors (e.g., Worthey et al. 1994; Thomas et al. 2003; A07) a
three-dimensional space defined by a Balmer absorption line (Hβ,
Hγ, or Hδ), the metallicity-sensitive [MgFe]′ index
(defined as  ),
and a metallic index particularly sensitive to the α-elements (like Mgb)
turns out a powerful diagnostic for the derivation of ages, metallicities, and
[α/Fe] ratios in unresolved stellar systems. The Hβ
index is poorly affected by α/Fe variations, but presents the
disadvantage that it can be significantly contaminated by nebular emission. The bluer
Hγ and Hδ lines are a valuable alternative to
Hβ because they are less affected by emission. However, because of the
limited wavelength range covered by our spectra, these lines are measured only in a few
galaxies. To avoid systematic effects caused by the use of Hγ and
Hδ only in some galaxies, we decided to base the entire derivation of
the stellar population parameters uniquely on Hβ.
),
and a metallic index particularly sensitive to the α-elements (like Mgb)
turns out a powerful diagnostic for the derivation of ages, metallicities, and
[α/Fe] ratios in unresolved stellar systems. The Hβ
index is poorly affected by α/Fe variations, but presents the
disadvantage that it can be significantly contaminated by nebular emission. The bluer
Hγ and Hδ lines are a valuable alternative to
Hβ because they are less affected by emission. However, because of the
limited wavelength range covered by our spectra, these lines are measured only in a few
galaxies. To avoid systematic effects caused by the use of Hγ and
Hδ only in some galaxies, we decided to base the entire derivation of
the stellar population parameters uniquely on Hβ.
 |
Fig. 1 Lick indices (Hβ vs. [MgFe]′, left panels, and Mgb vs. [MgFe]′, right panels) extracted at r < re/2 for the dwarf sample. From top to bottom, the galaxies were separated according to their group membership: RR143, RR210, RR216, and RR242. For RR242_13326, [MgFe]′ is a lower limit. The data are compared with SSP models of metallicities Z = 0.0004, 0.004, 0.008, 0.02, 0.05, ages = 13, 9, 6, 5, 4, 3, 2, 1.5 Gyr, and [α/Fe] = –0.4, 0., 0.4. |
Two projections of the 3D Hβ − [MgFe]′ − Mgb space are shown in Fig. 1. In the Hβ vs. [MgFe]′ plane, models of constant age run almost horizontal, while models of constant metallicity run almost vertical. This plane is poorly affected by α/Fe variations and is well suited to directly reading off ages and total metallicities almost independently of the specific chemical composition. In this plane, our galaxies cover the broadest possible range in age (~1–13 Gyr) and metallicity (Z = 0.0004–0.05).
In the Mgb vs. [MgFe]′ plane, models of constant age and metallicity are almost degenerate, while the [α/Fe] ratio is well separated. We notice that the bulk of our data is consistent with solar or subsolar [α/Fe] ratios (down to − 0.4 and even less), indicating an enhancement of the Fe-peak elements over the α-elements compared to the solar composition.
Ages, metallicities, and [α/Fe] ratios were derived through the
algorithm described in A07. Each model of given age (t), metallicity (Z),
and [α/Fe] ratio (α) univocally corresponds to a point
in the Hβ- ⟨ Fe ⟩ 2-Mgb
three-dimensional space. Given an observed index triplet
(Hβo ± σHβ,
⟨ Fe ⟩ o ± σ ⟨ Fe ⟩ ,
Mgbo ± σMgb), it is therefore possible to compute
the probability Pt,Z,α that the generic
(t, Z, α) model is the solution to
that data point: ![Mathematical equation: \begin{eqnarray} P_{t,~Z,~\alpha}&=& \frac{1}{\sqrt{(2 \pi)^3} \sigma_{\rm H\beta} \sigma_{\langle \rm Fe\rangle} \sigma_{\rm Mgb}} \exp \left[ -\frac{1}{2} \left( \frac{{\rm H}\beta-{\rm H}\beta_{\rm o}}{\sigma_{\rm H\beta}} \right)^2 \right. \nonumber \\ &&\left.- \frac{1}{2} \left( \frac{\langle {\rm Fe}\rangle-\langle {\rm Fe}\rangle_{\rm o}}{\sigma_{\langle {\rm Fe}\rangle}}\right)^2 -\frac{1}{2} \left(\frac{{\rm Mgb-Mgb}_{\rm o}}{\sigma_{\rm Mgb}}\right)^2 \right] \end{eqnarray}](/articles/aa/full_html/2011/04/aa15635-10/aa15635-10-eq109.png) (1)
(1)
where (Hβ, ⟨ Fe ⟩ , Mgb) is the index triplet associated to the
(t, Z, α) model. Equation (1) holds
if the errors are Gaussians. This allows us to derive a probability density map
Pt, Z, α
defined on the 3D (t, Z, α) space. Then
the solutions are computed to be  (2)
(2)
where X is the age t, the metallicity
Z, or the composition α, and
G∗ is the subspace of solutions defined by
P(t,Z,α) > 0.95Pmax.
The errors on the solutions are  (3)computed
over the whole (t, Z, α) space.
(3)computed
over the whole (t, Z, α) space.
The goodness of the solution is evaluated through the “distance” between the data and the
solution. From Pbestfit, the probability obtained substituting
into Eq. (1) the index values of the best fit model, we define three quality flags:
![Mathematical equation: \begin{eqnarray} &&C \times P_{\rm best~ fit} \ge \exp \left[-3/2 \right] \ \ \ {\rm flag}=1 \\ &&\exp \left[-6 \right] \le C \times P_{\rm best~ fit} < \exp \left[-3/2 \right] \ \rm flag=2 \\ &&C \times P_{\rm best~ fit} < \exp \left[-6 \right] \ \ \ \rm flag=3 \end{eqnarray}](/articles/aa/full_html/2011/04/aa15635-10/aa15635-10-eq118.png) where
where
 . The adopted
limits for the three flags correspond respectively to 1σ,
2σ, and 3σ differences between the observed indices
and the best-fit model; thus the quality of the solution is the best for flag = 1, and the
worst for flag = 3. The derived stellar population parameters, as well as the quality of
the solutions, are given in Table 5. Because of the
indices used to derive the stellar population parameters, [α/Fe] directly
reflects a [Mg/Fe] ratio. Because of the lack of the Fe5335 index, only upper/lower limits
could be derived for RR242_13326. Two galaxies, namely RR143_09192 and RR242_36267, have a
quality flag of 2. They are very low in Mgb, and for them our algorithm provides the
lowest [α/Fe] values allowed by the models. It is likely that the errors
on their indices were underestimated. For all the other galaxies, the quality flag is 1.
. The adopted
limits for the three flags correspond respectively to 1σ,
2σ, and 3σ differences between the observed indices
and the best-fit model; thus the quality of the solution is the best for flag = 1, and the
worst for flag = 3. The derived stellar population parameters, as well as the quality of
the solutions, are given in Table 5. Because of the
indices used to derive the stellar population parameters, [α/Fe] directly
reflects a [Mg/Fe] ratio. Because of the lack of the Fe5335 index, only upper/lower limits
could be derived for RR242_13326. Two galaxies, namely RR143_09192 and RR242_36267, have a
quality flag of 2. They are very low in Mgb, and for them our algorithm provides the
lowest [α/Fe] values allowed by the models. It is likely that the errors
on their indices were underestimated. For all the other galaxies, the quality flag is 1.
In conclusion, we derived the stellar population parameters for 13 dwarf galaxies (plus one upper/lower limit). The median values and scatters around the medians for age, log Z/Z⊙, and [α/Fe] are 5.2 ± 4.1 Gyr, −0.42 ± 0.38, and −0.23 ± 0.44, respectively. For the subsample of 12 dwarf early-types, the medians are: 5.7 ± 4.2 Gyr, −0.30 ± 0.37, and −0.07 ± 0.43. If we exclude the two quality-flag = 2 objects (RR143_09192 and RR242_36267) we obtain, for a fiducial subsample of 10 early-type dwarfs, values of 5.7 ± 4.4 Gyr, −0.26 ± 0.28, and −0.04 ± 0.33.
4. Correlations with internal galaxy properties: nature
4.1. Correlations with velocity dispersion
Studies of integrated stellar populations in ETGs have revealed scaling relations between the luminosity weighted age, metallicity, or [α/Fe] ratio, and the galaxy velocity dispersion (e.g., Thomas et al. 2005; Clemens et al. 2006; A07; Clemens et al. 2009). These relations confirm that the galaxy potential well is the main driver of the evolution of the stellar populations. The average stellar metallicity and the [α/Fe] ratio increase with σ, indicating that the chemical enrichment was more efficient and faster in more massive galaxies. At the same time, an increase in galaxy ages with σ is observed. These scaling relations suggest “downsizing” in galaxy formation, meaning that more massive galaxies formed their stars earlier and faster than lower mass galaxies.
The galaxy sample examined in this paper covers velocity dispersions (measured at
r < re/2) in the range
40–108 km s-1 and absolute R magnitudes in the range
−14.8– −19.8 mag (see Table 2). This allows us
to extend the scaling relations usually derived for giant ETGs to the
low-σ regime. We plot the derived ages, metallicities, and
[α/Fe] ratios versus
σre/2 in Fig. 2. For comparison, we include a selection of galaxies
from the bright ETGs of A07 satisfying the following requirements: 1) reside in comparable
environment as our dwarfs according to the volume density (see Col. 8 of Table 2), i.e.,
ρxyz ≲ 1.2 Mpc-3 (Tully 1988a); 2) have a measure of
σre/2; 3) have absent or
very low nebular emission according to A10. The last requirement is because, for a
self-consistent comparison between the two samples, the stellar population parameters for
the A07 galaxies must be derived using the same indices (Hβ, [MgFe]′,
Mgb), SSPs, and algorithm as for the dwarf sample (they can be retrieved from the
electronic Table 5 of A07). Because of the strong uncertainty in the Hβ
emission correction, and the impossibility of using the higher order Balmer lines, we have
to exclude the A07 galaxies with strong emission lines. We end up with 12 galaxies from
the A07 sample (NGC 1407, NGC 1426, NGC 3557, NGC 3818, NGC 4697, NGC 5638, NGC 5812,
NGC 5813, NGC 5831, NGC 6721, NGC 7192, and NGC 7332), which have
σre/2 in the range
120–270 km s-1, and absolute R magnitudes in the range
− 20.8– − 22.9. In Fig. 2, we show the least square
fits to the total dwarf + giant ETG sample. We have excluded from the fit the Sc galaxy
RR216_12209 and the two galaxies (RR143_09192 and RR242_36267) for which the quality of
the SSP fit was not very good (quality flag = 2, see Sect. 3.2 for details). We derive the
following relations: ![Mathematical equation: \begin{eqnarray} \log {\rm Age[yr]}&=& (0.39\pm0.22) \times \log \sigma_{r_{\rm e}/2} [{\rm km\, s}^{-1}] + ( 9.09\pm0.45) \nonumber \\ &&~~~~~~~~~~~~~~~~~~~~~~~~~~~~~~~~~~~~~~~~~~~~~\rm [{\rm rms}=0.24] \end{eqnarray}](/articles/aa/full_html/2011/04/aa15635-10/aa15635-10-eq130.png) (7)
(7)![Mathematical equation: \begin{eqnarray} \log Z/Z_{\odot}&=& (0.80\pm0.16) \times \log \sigma_{r_{\rm e}/2} \rm [km\, s^{-1}] -(1.66\pm0.33) \nonumber \\ &&~~~~~~~~~~~~~~~~~~~~~~~~~~~~~~~~~~~~~~~~~~~~~~~~~[{\rm rms}=0.17] \end{eqnarray}](/articles/aa/full_html/2011/04/aa15635-10/aa15635-10-eq131.png) (8)
(8)![Mathematical equation: \begin{eqnarray} [\alpha/{\rm Fe}]&=& (0.42\pm0.22) \times \log \sigma_{r_{\rm e}/2} \rm [km \, s^{-1}] -(0.74\pm0.46) \nonumber \\ &&~~~~~~~~~~~~~~~~~~~~~~~~~~~~~~~~~~~~~~~~~~~~~~~~~~~~[{\rm rms}=0.24]. \end{eqnarray}](/articles/aa/full_html/2011/04/aa15635-10/aa15635-10-eq132.png) (9)Equations
(7) through (9) show that age, metallicity, and [α/Fe] ratio tend to
increase with σ. Lower mass galaxies tend to be younger, metal poorer,
and less enhanced in the α-elements (with solar or even subsolar
[α/Fe] ratios) than more massive ETGs. This is consistent with the
extrapolation of the trends seen in bright ETGs. A (non parametric) Spearman rank-order
test gives correlation coefficients of 0.37, 0.73, and 0.45 (N
galaxies = 22) for age, metallicity, and [α/Fe] ratio, respectively,
corresponding to probabilities of 91%, 99.99%, and 96.44% for correlations to exist. Thus
the strongest correlation is between metallicity and σ, while age is
weakly correlated. This agrees with previous studies that find strong correlations between
metallicity or [α/Fe] and σ, but weaker correlations
between age and σ (e.g., Kuntschner et al. 2001; Thomas et al. 2005).
(9)Equations
(7) through (9) show that age, metallicity, and [α/Fe] ratio tend to
increase with σ. Lower mass galaxies tend to be younger, metal poorer,
and less enhanced in the α-elements (with solar or even subsolar
[α/Fe] ratios) than more massive ETGs. This is consistent with the
extrapolation of the trends seen in bright ETGs. A (non parametric) Spearman rank-order
test gives correlation coefficients of 0.37, 0.73, and 0.45 (N
galaxies = 22) for age, metallicity, and [α/Fe] ratio, respectively,
corresponding to probabilities of 91%, 99.99%, and 96.44% for correlations to exist. Thus
the strongest correlation is between metallicity and σ, while age is
weakly correlated. This agrees with previous studies that find strong correlations between
metallicity or [α/Fe] and σ, but weaker correlations
between age and σ (e.g., Kuntschner et al. 2001; Thomas et al. 2005).
 |
Fig. 2 Ages, metallicities, and [α/Fe] ratios at r < re/2 versus velocity dispersion. Different symbols indicate the group membership. For comparison, we also plot the stellar population parameters for a selection of galaxies from the bright ETGs of A07 (open triangles, see text for details). The solid line indicates the least-square linear fit to the (dwarf + giant) ETG sample, where we have excluded the Sc galaxy RR216_12209 (big open circle), and the two low quality-fit galaxies (see Sect. 3.2 for details): RR143_09192 (big open square) and RR242_36267 (big filled circle). The dashed and dotted lines are the separate fits to the dwarf (σre/2 < 100 km s-1) and giant (σre/2 ≥ 100 km s-1) samples, respectively. The slope (α), zero-point (β), and scatter of the fits are indicated in the panels. |
4.2. Correlations with morphology
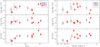 |
Fig. 3 Stellar population parameters (ages, metallicities, and [α/Fe] ratios) as a function of morphology. Left panel: bulge fraction B/T; right panel: Sersic index n. Different symbols indicate the group membership: RR 210 (blue triangles), RR 216 (black open circles), and RR 242 (red full dots). We use larger symbols to indicate the Sc galaxy RR216_12209 (open circle) and the low-quality fit galaxy RR242_36267 (filled circle). |
In this section we investigate possible relations between the stellar population parameters and the galaxy’s morphology, i.e. the bulge fraction, B/T, and the Sersic index n. Figure 3 shows ages, metallicities, and [α/Fe] ratios as a function of B/T (left panel) and n (right panel) for our sample. In the plot, we do not show RR143_09192, since its morphological parameters are not robust because of a bright star very close to the centre of this galaxy. We also exclude from the following analysis RR242_36267, which has a quality flag = 2 in the derived stellar population parameters (see Sect. 3.2), and RR216_12209, which is classified as an Sc. A (non parametric) Spearman rank-order test gives correlation coefficients of 0.04, − 0.05, and 0.83 with N galaxies = 10 for age, metallicity, and [α/Fe] ratio versus B/T, respectively, indicating that the only strong correlation is between [α/Fe] and the bulge-to-total light fraction (P ~ 99.7%). For the Sersic index n, we derive lower correlation coefficients of − 0.53, 0.31, and 0.33. We notice that there is one outlier, RR242_ 28727, which has a high B/T ratio but relatively small n. This galaxy is located very close to the bright elliptical of the pair, and the Sersic fit might be biased by the light of the close bright neighbour.
In Fig. 4, we study the relationship between stellar population parameters versus morphology on a broader luminosity baseline, by adding the bright ETGs of A07. Sersic indices were measured from SDSS images for 6 galaxies among the subset of the A07 sample (Marino et al. 2010). Bulge-to-total light fractions for the A07 sample are not available. The Spearman correlation coefficients are 0.07, 0.58, and 0.54 (N = 16) for age, metallicity, and [α/Fe] versus n, respectively, indicating that significant correlations are only present for metallicity and [α/Fe] (with probabilities of 98.1% and 96.9%, respectively). The presence of correlations between metallicity and n, and between [α/Fe] and n, is expected from the fact that the metallicity and the [α/Fe] ratio correlate with σ, and σ correlates with n (see top panel of Fig. 4).
 |
Fig. 4 Velocity dispersion σ, age, metallicity and [α/Fe] ratio as a function of the Sersic index n. Full dots are the early-type dwarfs of this paper, while open triangles are the bright ETGs selected from A07 (see text for details). We excluded RR143_09192 and RR242_36267, for which we obtain a low-quality fit (see Sect. 3.2), and RR216_12209, which is classified as an Sc. |
5. The role of environment: nurture
5.1. Correlations with local galaxy density
To investigate the effect of local galaxy density within the group environment, we plotted the stellar population parameters versus Σ3 in Fig. 5. As already explained in Sect. 2.5, Σ3 is sensitive to very local galaxy concentrations, and can vary significantly within the same group.
If we exclude RR143_09192 and RR242_36267, for which we obtain a low-quality fit (see Sect. 3.2), and RR216_12209, which is classified as an Sc, we derive Spearman correlation coefficients of 0.35, − 0.1, and 0.42 (10 data points) for age, metallicity, and [α/Fe] ratio, indicating that there is no significant correlation. However, Σ3 is a projected galaxy density, and projection effects can considerably distort the intrinsic 3D galaxy density. A de-projected density could be derived assuming a certain distribution for the galaxies in the 3D space (e.g., Poggianti et al. 2010), but due to the low number of galaxies in each group, a statistical correction based on the assumption that the galaxies are evenly distributed within the group halo is not very meaningful. Also Σ3 represents an upper limit to the 3D galaxy density.
 |
Fig. 5 Stellar population parameters as a function of surface local density. From top to bottom: age, metallicity, and [α/Fe] ratio. The symbols are the same as in Fig. 2. |
5.2. Comparison with the cluster environment
According to the large-scale densities ρxyz given in Col. 8 of Table 2, our dwarf galaxies are representative of the LDE. In this section, we compare the properties of our sample with those of cluster dwarfs previously studied in the literature.
Line-strength index studies of dwarf ETGs were mainly preformed in the Virgo (Gorgas et al. 1997; Geha et al. 2003; van Zee et al. 2004; Michielsen et al. 2008; Paudel et al. 2010) and Coma (Poggianti et al. 2001; Smith et al. 2009; Matković et al. 2009) clusters. However, when comparing our dataset with others, it is important to make sure that the extraction apertures sample comparable portions of the galaxy light, because of the radial gradients in the stellar populations. The relatively short distance to Virgo implies that literature data typically sample very central galaxy regions (r < 0.15 re), and a comparison with our larger aperture data is not very meaningful. On the other hand, literature data for Coma, at a larger distance than Virgo, typically sample larger apertures, and are more suitable for a comparison with our sample. Smith et al. (2009) provide Lick indices for faint red galaxies observed in two 1° fields, one centred on the Coma cluster core and the other located 1° to the south-west of the cluster centre. The galaxies have Mr ≲ − 17, and velocity dispersions in the range 20–80 km-1. The spectra were collected with a 1.5″ fibre diameter, corresponding, given the median effective radius of re ~ 3″, to an r < re/4 aperture. Since the use of a re/4 instead of a re/2 aperture implies only small offsets in δ log t, δ log Z, and δ [α/Fe] (~0.037, 0.025 and < 0.02 at σ ~ 100 km s-1 from Fig. 2 of Clemens et al. 2009), the Smith et al. (2009) data are suitable for comparison with our sample. We selected the Coma dwarfs in the 1° field centred on the cluster core.
To avoid systematic effects of using different stellar population models, we reprocessed the Hβ, Fe5270, Fe5335, and Mgb indices provided by Smith et al. (2009), their Table E1, with our own SSPs according to the procedure described in Sect. 3 (the derived ages, metallicities, and [α/Fe] ratios are given in Appendix A). In Fig. 6 we show the Coma dwarfs in the Age/ Z/ [α/Fe] versus σ planes, together with the dwarfs of our sample (LDE) and the giants of A07. We draw least-square linear fits to the (Coma dwarfs + A07 giants) and to the (LDE dwarfs + A07 giants) samples separately. A comparison of the fit parameters provided in Figs. 6 and 2 shows that the slopes are compatible within the errors.
 |
Fig. 6 Age, metallicity, and [α/Fe] ratio versus σ. Open circles are the Coma dwarfs from Smith et al. (2009), filled circles are the low-density environment (LDE) dwarfs of this paper (we have excluded RR143_09192 and RR242_36267, which have a poor quality SSP fit, see Sect. 3.2, and RR216_12209, which is an Sc), while open triangles are the ETGs of A07. The solid and dotted lines are the least square linear fits to the (Coma dwarfs + A07) and (LDE dwarfs + A07) samples, respectively. |
 |
Fig. 7 Age, metallicity, and [α/Fe] distributions for our early-type dwarfs and for red passive dwarfs in a field centered on the Coma core. All galaxies were selected to have σ in the range 40–70 km s-1. Vertical arrows indicate the median values for the two samples. Within our sample, we did not include RR143_09192 and RR242_36267, which have a poor quality SSP fit (see Sect. 3.2), and the Sc galaxy RR216_12209. |
To isolate the effect of environment, we selected galaxies with velocity dispersions in the range 40–70 km s-1 and investigated possible differences in age, metallicity, and [α/Fe]. We did not include RR143_09192 and RR242_36267, which have a poor quality SSP fit (see Sect. 3.2), and the Sc galaxy RR216_12209. The result of this analysis is shown in Fig. 7, where we plot the distributions of the stellar population parameters for our early-type dwarfs and for the Coma red passive dwarfs. The median ages, metallicities (log Z/Z⊙), and [α/Fe] ratios are 5.7 ± 3.6 Gyr and 6.7 ± 3.9 Gyr, −0.41 ± 0.22 and −0.26 ± 0.26, and −0.07 ± 0.36 and 0.06 ± 0.11 for us and Coma, respectively. At face values, the medians indicate that LDE dwarfs are on average younger, less metal rich, and less enhanced in [α/Fe] (longer star formation timescales) than Coma dwarfs. We performed statistical tests to check the significance of the difference between the two samples. According to a Mann-Withney U test, the age, metallicity, and [α/Fe] distributions shown in Fig. 7 are not significantly different. On the other hand, a two-sample Kolmogorov-Smirnov test provides Dn,m values of 0.58, 0.51, and 1.61 for age, metallicity, and [α/Fe], respectively, corresponding to probabilities of 0.89, 0.96, and 0.01 that the two datasets come from the same distribution. The K-S test implies that there is a difference in [α/Fe] between the two samples, since the probability that they come from the same distribution is only ~1%. Concluding, we find evidence that LDE dwarfs experienced longer star formation timescales than their cluster counterparts. However, these results need to be confirmed through larger data samples.
6. Discussion and conclusions
Using Lick indices, we have derived luminosity-weighted ages, metallicities, and [α/Fe] ratios for a sample of 13 dwarf galaxies, 12 of which are early-type, located in poor groups dominated by a bright E+S galaxy pair (Grützbauch et al. 2009). The groups typically have less than 5 bright (~L∗) galaxies, and are characterized by local densities (as defined by Tully 1988a) of ρxyz ≲ 1.2 Mpc-3. The dwarf galaxies in our sample therefore reside in LDE. They have velocity dispersions in the range (40–108) km s-1 and MR varies from − 19.8 to − 14.8.
For our fiducial subsample of 10 dwarf ETGs, we derived median values and scatters around the medians of 5.7 ± 4.4 Gyr, −0.26 ± 0.28, and −0.04 ± 0.33 for age, log Z/Z⊙, and [α/Fe] , respectively. For a selection of bright ETGs from the A07 sample residing in a comparable environment, we derived median values of 9.8 ± 4.1 Gyr, 0.06 ± 0.16, and 0.18 ± 0.13 for the same stellar population parameters. Thus, it emerges that dwarfs are on average younger, less metal rich, and less enhanced in the α-elements than giants, in agreement with other studies of dwarf galaxies (e.g., Geha et al. 2003; van Zee et al. 2004; Michielsen et al. 2008; Smith et al. 2009, Spolaor et al. 2010), and with the extrapolation to the low-mass regime of the scaling relations derived for giant ETGs (e.g., Nelan et al. 2005; Thomas et al. 2005; Clemens et al. 2009). Considering the total (dwarf + giant) sample, we find that age ∝ σ0.39 ± 0.22, Z ∝ σ0.80 ± 0.16, and α/Fe ∝ σ0.42 ± 0.22.
The low [α/Fe] ratios derived for the dwarfs imply long star formation (SF) timescales, as opposed to the short SF timescales in giant ETGs, in agreement with “downsizing” in galaxy formation. In fact, α-elements are mainly produced in massive stars and restored into the interstellar medium (ISM) through the explosion of type II SNe on short SF timescales (<50 Myr). On the other hand, Fe, mostly provided by type Ia SNe, which are associated with the evolution of intermediate and low-mass stars, is injected into the ISM on much longer timescales: the time in maximum enrichment by SNIa varies from ~40−50 Myr for an instantaneous starburst to ~0.3 Gyr for a typical elliptical galaxy to ~4.0−5.0 Gyr for a spiral galaxy (Matteucci & Recchi 2001). Thus, besides the obvious initial mass function (IMF) effect, the [α/Fe] ratio brings the signature of the timescale over which SF has occurred (e.g., Greggio & Renzini 1983; Tornambé & Matteucci 1986). Subsolar [α/Fe] ratios are explained by chemical-evolution models assuming a low rate of SF and a long timescale for the collapse (e.g., Matteucci 2001). Lanfranchi & Matteucci (2003) have shown that a low SF efficiency and a high wind efficiency can explain the abundance patterns in dwarf spheroidal galaxies (dSphs) of the Local Group (LG), which exhibit highly subsolar [α/Fe] ratios at [Fe/H] ≳ −1 (see review by Tolstoy et al. 2009 and reference therein). Marconi et al. (1994) showed that subsolar [α/Fe] ratios can be obtained with a large number of SF episodes and by assuming differential galactic winds that are more efficient in depriving the galaxy of the α than of Fe since activated only during the bursts where most of the α-elements are formed,
The presence of an [α/Fe] versus σ correlation implies that the galaxy gravitational potential well regulates the timescale over which the SF occurs. In fact, the gas evolution within the dark matter halo is controlled by the interplay of several factors, such as gravity, radiative cooling, and heating by SN feedback, and possibly by an active galactic nucleus (e.g., Chiosi & Carraro 2002; Granato et al. 2004). In shallower potential wells, SN feedback is increasingly effective in slowing down the SF and driving gas outflows. As a consequence, the SF is faster within the most massive haloes. We also see that the scatter around the age vs. σ and α/Fe vs. σ relations is larger for dwarfs than for giants. This has already been noticed by Concannon et al. (2000) and Smith et al. (2009) using larger data samples (~100 and 90 ETGs, respectively). In particular, Concannon et al. (2000) claim that the increase in the Hβ scatter at the low-mass end indicates that the smaller galaxies have experienced a more varied star formation history (SFH) and that these galaxies have a wider range in age than their brighter counterparts. This result is consistent with the variety of SFHs derived for dSph galaxies in the LG from colour–magnitude diagram (CMD) fitting. Ancient ( > 8 Gyr) SF is always detected; however, while some galaxies show no evidence of stars younger than 8 Gyr, others exhibit prolonged star formations, up to few hundred Myrs ago (e.g., Dolphin 2002; Battaglia et al. 2006; Monelli et al. 2010a,b).
We investigated whether, besides the galaxy velocity dispersion, the average ages, metallicities, and [α/Fe] ratios correlate with other internal galaxy properties, in the specific morphology (i.e., bulge-to-total light fraction B/T and Sersic index n). We found that the metallicity and the [α/Fe] ratio correlate positively with n, while the correlation of age with n is weak. The presence of correlations between metallicity and n, and between [α/Fe] and n, is expected from the fact that the metallicity and the [α/Fe] ratio correlate with σ and that σ correlates with n (see top panel of Fig. 4 and also Trujillo et al. 2004): more massive galaxies tend to be more centrally concentrated, showing higher n. This is also observed if the stellar population parameters are analysed as a function of the bulge-to-total light fraction B/T: the [α/Fe] appears to be strongly correlated with B/T, in the sense that the more dominant the bulge, the faster the star formation timescale.
The presence of a morphology-[α/Fe] relation seems to contradict the possible evolution along the Hubble sequence from low B/T (low n) to high B/T (high n) galaxies, since it is not possible to produce supersolar [α/Fe] stars from a gas that is already enriched in Fe. In other words, systems similar to present-day dwarf galaxies could not be the building blocks of today’s giant ellipticals. This is reminiscent of the problem of the assembly of the MW halo. The hierarchical formation scenario for the Galactic halo requires the accretion and disruption of dwarf galaxies (Searle & Zinn 1978), and yet abundance measurements show that low-metallicity halo stars are enriched in α-elements compared to low-metallicity stars in dSph galaxies (see review by Tolstoy et al. 2009, and reference therein). A way to reconcile the observational evidence with a hierarchical formation for the halo is to assume that it formed at early times from a few relatively massive satellites with short-lived, rapid SFHs, and with stars enhanced in [α/Fe]. Surviving dSphs, characterized by a slower, less efficient SF, are not representative of a typical halo star (Robertson et al. 2005).
From the study of 48 ETGs from the SAURON sample, Kuntschner et al. (2010) suggest that the [α/Fe]-σ relation is largely driven by an increasing relative contribution with decreasing galaxy luminosity from mildly [α/Fe] depressed disk-like components that host secondary SF. This seems to agree with our finding of a strong correlation between [α/Fe] and n. However, we do not see a strong correlation between age and n, which instead should be observed if the contribution from a star-forming disk increases with decreasing n. An explanation for this could be that the age is less robustly derived than the [α/Fe] ratio, because of the large uncertainties in the emission correction to the Hβ index. Indeed, several studies find a wide spread around the age versus σ relation, despite the strong correlation between [α/Fe] and σ (e.g., Kuntschner et al 2001; Thomas et al. 2005; A07), suggesting that the [α/Fe] maybe a better measure of the SF timescales.
Another possibility is that the [α/Fe] vs. n relation is driven by a progressive variation in the IMF with increasing galaxy luminosity/concentration, in the sense that less concentrated galaxies are less efficient in producing high-mass stars. Indeed, some studies (e.g., Hoversten & Glazebrook 2008; Meurer et al. 2009) have claimed there are systematic variations in the IMF with galaxy properties such as mass, luminosity, and surface brightness. These studies use large galaxy data samples and are based on the comparison of the Hα emission with optical colour diagrams or with the FUV emission. They suggest that low-luminosity/low-surface brightness galaxies have less massive stars than higher luminosity/higher surface brightness galaxies. The idea is that regions of high pressure favour the formation of bound clusters resulting in an increased fraction of high-mass stars (see Moeckel & Clarke 2011; and discussion in Meurer et al. 2009).
Finally, we studied the effect of environment on the evolution of dwarf galaxies. First, we investigated, within the group environment, the effect of local galaxy density on the evolution of the stellar populations by analysing the average ages, metallicities and [α/Fe] ratios as a function of the local surface galaxy density Σ3, based on the distance to the third nearest neighbour. We do not find any significant correlations with Σ3. However, Σ3 is a projected surface density, and it can be significantly different from the intrinsic 3D galaxy density. Projection effects can weaken considerably the correlations with the stellar population parameters.
Our dwarfs, which reside in LDE, were also compared with Coma red passive dwarfs already studied in the literature (Smith et al. 2009). According to a Mann-Withney test, the age, metallicity, and [α/Fe] distributions for the Coma core and LDE dwarfs are not significantly different, while a Kolmogorov-Smirnov test indicates that there is a significant difference between the [α/Fe] distributions, in the sense that LDE dwarfs exhibit lower ratios than Coma dwarfs. Concluding, we find possible evidence that LDE dwarfs experienced a more prolonged SF than their cluster counterparts, but these results need to be confirmed with larger data samples.
Previous works, based on larger data samples, pointed out a clear effect of local density on the evolution of dwarf galaxies in clusters, revealing a trend toward younger mean ages and more extended SFHs with increasing cluster-centric radius (Coma: Poggianti et al. 2001; Smith et al. 2008; 2009; Abell 496: Chilingarian et al. 2008; Virgo: Michielsen et al. 2008; Toloba et al. 2009), while Paudel, et al. (2010) found no significant difference in Virgo. These results are particularly interesting at the light of the fact that no significant difference in [α/Fe] is observed for giant ETGs in the cluster and in the field (see e.g., Clemens et al. 2009). “Suffocation”, ram-pressure stripping, and galaxy harassment may be effective in depriving dwarf galaxies from their gas reservoir, thus halting star formation. Dwarf galaxies residing in LDE are likely to retain their gas content and sustain star formation for a longer period of time.
The global scenario that emerges from our study and previous analyses is that dwarfs and giants had a different evolution. Giant ETGs seem uniquely affected by their own nature (mass) and exhibit old ages and short evolutionary timescales ( ≲ 1 Gyr); dwarfs present a variety of SFHs, appear on average younger than giants, and seem to be more affected by the environment (nurture).
We can sketch a picture in which today massive ETGs, which completed their star formation process at early times, before the emergence of structures, do not exhibit strong environmental dependence; on the other hand, low mass galaxies, which evolved much slower and could eventually feel the effect of environment, bring today the sign of nurture. This scenario is in agreement with findings based on large redshift surveys, which revealed an increasing environmental effect on galaxy evolution moving from higher to lower redshift, and from higher to lower galaxy stellar masses (Iovino et al. 2010; Peng et al. 2010; Grützbauch et al. 2010).
The SSPs are downloadable at http://web.oapd.inaf.it/rampazzo/SSPs-tables.html
 .
.
Acknowledgments
F.A. thanks M. Tosi, D. Romano and M. Monelli for useful discussions. We thank the anonymous referee for his/her useful comments which helped to improve the paper.
References
- Annibali, F., Bressan, A., Rampazzo, R., Zeilinger, W. W., & Danese, L. 2007, A&A, 463, 455 [NASA ADS] [CrossRef] [EDP Sciences] [Google Scholar]
- Annibali, F., Bressan, A., Rampazzo, R., et al. 2010, A&A, 519, A40 [NASA ADS] [CrossRef] [EDP Sciences] [Google Scholar]
- Bamford, S. P., Nichol, R. C., Baldry, I. K., et al. 2009, MNRAS, 393, 1324 [NASA ADS] [CrossRef] [Google Scholar]
- Battaglia, G., Tolstoy, E., Helmi, A., et al. 2006, A&A, 459, 423 [NASA ADS] [CrossRef] [EDP Sciences] [Google Scholar]
- Bekki, K., Couch, W. J., & Shioya, Y. 2001, PASJ, 53, 395 [NASA ADS] [Google Scholar]
- Bekki, K., Couch, W. J., & Shioya, Y. 2002, ApJ, 577, 651 [NASA ADS] [CrossRef] [Google Scholar]
- Bertelli, G., Bressan, A., Chiosi, C., Fagotto, F., & Nasi, E. 1994, A&AS, 106, 275 [NASA ADS] [Google Scholar]
- Binggeli, B., Tarenghi, M., & Sandage, A. 1990, A&A, 228, 42 [NASA ADS] [Google Scholar]
- Bressan, A., Chiosi, C., & Fagotto, F. 1994, ApJS, 94, 63 [NASA ADS] [CrossRef] [Google Scholar]
- Bressan, A., Chiosi, C., & Tantalo, R. 1996, A&A, 311, 425 [NASA ADS] [Google Scholar]
- Caffau, E., Maiorca, E., Bonifacio, P., et al. 2009, A&A, 498, 877 [NASA ADS] [CrossRef] [EDP Sciences] [Google Scholar]
- Cappellari, M., & Emsellem, E. 2004, PASP, 116, 138 [NASA ADS] [CrossRef] [Google Scholar]
- Chilingarian, I. V., Cayatte, V., Durret, F., et al. 2008, A&A, 486, 85 [NASA ADS] [CrossRef] [EDP Sciences] [Google Scholar]
- Chiosi, C. 2001, MmSAI, 72, 733 [NASA ADS] [Google Scholar]
- Chiosi, C., & Carraro, G. 2002, MNRAS, 335, 335 [NASA ADS] [CrossRef] [Google Scholar]
- Cimatti, A., Daddi, E., & Renzini, A. 2006, A&A, 453, L29 [NASA ADS] [CrossRef] [EDP Sciences] [Google Scholar]
- Clemens, M. S., Bressan, A., Nikolic, B., et al. 2006, MNRAS, 370, 702 [NASA ADS] [CrossRef] [Google Scholar]
- Clemens, M. S., Bressan, A., Nikolic, B., & Rampazzo, R. 2009, MNRAS, 392, 35 [Google Scholar]
- Concannon, K. D., Rose, J. A., & Caldwell, N. 2000, ApJ, 536, L19 [NASA ADS] [CrossRef] [PubMed] [Google Scholar]
- De Lucia, G., Springel, V., White, S. D. M., Croton, D., & Kauffmann, G. 2006, MNRAS, 366, 499 [NASA ADS] [CrossRef] [Google Scholar]
- Denicoló, G., Terlevich, R., Terlevich, E., Forbes, D. A., & Terlevich, A. 2005, MNRAS, 358, 813 [NASA ADS] [CrossRef] [Google Scholar]
- di Serego Alighieri, S., Lanzoni, B., & Jørgensen, I. 2006, ApJ, 647, L99 [NASA ADS] [CrossRef] [Google Scholar]
- Dolphin, A. E. 2002, MNRAS, 332, 91 [NASA ADS] [CrossRef] [Google Scholar]
- Dressler, A., Oemler, A., Jr., Couch, W. J., et al. 1997, ApJ, 490, 577 [NASA ADS] [CrossRef] [Google Scholar]
- Fontana, A., Salimbeni, S., Grazian, A., et al. 2006, A&A, 459, 745 [NASA ADS] [CrossRef] [EDP Sciences] [Google Scholar]
- Fulbright, J. P., McWilliam, A., & Rich, R. M. 2007, ApJ, 661, 1152 [NASA ADS] [CrossRef] [Google Scholar]
- Gallazzi, A., Charlot, S., Brinchmann, J., White, S. D. M., & Tremonti, C. A. 2005, MNRAS, 362, 41 [NASA ADS] [CrossRef] [Google Scholar]
- Geha, M., Guhathakurta, P., & van der Marel, R. P. 2003, AJ, 126, 1794 [NASA ADS] [CrossRef] [Google Scholar]
- Gobat, R., Rosati, P., Strazzullo, V., et al. 2008, A&A, 488, 853 [NASA ADS] [CrossRef] [EDP Sciences] [Google Scholar]
- Gómez, P. L., Nichol, R. C., Miller, C. J., et al. 2003, ApJ, 584, 210 [NASA ADS] [CrossRef] [Google Scholar]
- Gorgas, J., Pedraz, S., Guzman, R., Cardiel, N., & Gonzalez, J. J. 1997, ApJ, 481, L19 [NASA ADS] [CrossRef] [Google Scholar]
- Goudfrooij, P., & Emsellem, E. 1996, A&A, 306, L45 [NASA ADS] [Google Scholar]
- Granato, G. L., De Zotti, G., Silva, L., Bressan, A., & Danese, L. 2004, ApJ, 600, 580 [Google Scholar]
- Greggio, L., & Renzini, A. 1983, Mem. Soc. Astron. Ital., 54, 311 [Google Scholar]
- Grützbauch, R., Trinchieri, G., Rampazzo, R., et al. 2007, AJ, 133, 220 [NASA ADS] [CrossRef] [Google Scholar]
- Grützbauch, R., Zeilinger, W. W., Rampazzo, R., et al. 2009, A&A, 502, 473 [NASA ADS] [CrossRef] [EDP Sciences] [Google Scholar]
- Grützbauch, R., Conselice, C. J., Varela, J., et al. 2010, MNRAS, 411, 929 [Google Scholar]
- Haines, C. P., Gargiulo, A., La Barbera, F., et al. 2007, MNRAS, 381, 7 [NASA ADS] [CrossRef] [Google Scholar]
- Häussler, B., McIntosh, D. H., Barden, M., et al. 2007, ApJS, 172, 615 [NASA ADS] [CrossRef] [EDP Sciences] [Google Scholar]
- Hoversten, E. A., & Glazebrook, K. 2008, ApJ, 675, 163 [NASA ADS] [CrossRef] [Google Scholar]
- Held, E. V., & Mould, J. R. 1994, AJ, 107, 1307 [NASA ADS] [CrossRef] [Google Scholar]
- Iovino, A., Cucciati, O., Scodeggio, M., et al. 2010, A&A, 509, A40 [NASA ADS] [CrossRef] [EDP Sciences] [Google Scholar]
- Kauffmann, G. 1995, MNRAS, 274, 153 [NASA ADS] [Google Scholar]
- Kauffmann, G. 1996, MNRAS, 281, 487 [NASA ADS] [CrossRef] [Google Scholar]
- Kauffmann, G., White, S. D. M., Heckman, T. M., et al. 2004, MNRAS, 353, 713 [NASA ADS] [CrossRef] [Google Scholar]
- Koleva, M., de Rijcke, S., Prugniel, P., Zeilinger, W. W., & Michielsen, D. 2009, MNRAS, 396, 2133 [NASA ADS] [CrossRef] [Google Scholar]
- Korn, A. J., Maraston, C., & Thomas, D. 2005, A&A, 438, 685 [NASA ADS] [CrossRef] [EDP Sciences] [Google Scholar]
- Kuntschner, H., Lucey, J. R., Smith, R. J., Hudson, M. J., & Davies, R. L. 2001, MNRAS, 323, 615 [NASA ADS] [CrossRef] [Google Scholar]
- Kuntschner, H., Smith, R. J., Colless, M., et al. 2002, MNRAS, 337, 172 [NASA ADS] [CrossRef] [Google Scholar]
- Kuntschner, H., Emsellem, E., Bacon, R., et al. 2010, MNRAS, 408, 97 [NASA ADS] [CrossRef] [Google Scholar]
- La Barbera, F., Lopes, P. A. A., de Carvalho, R. R., de la Rosa, I. G., & Berlind, A. A. 2010, MNRAS, 408, 1361 [NASA ADS] [CrossRef] [Google Scholar]
- Lanfranchi, G. A., & Matteucci, F. 2003, MNRAS, 345, 71 [NASA ADS] [CrossRef] [Google Scholar]
- Le Fèvre, O., and the VVDS Team 2003, The Messenger, 111, 18 [NASA ADS] [Google Scholar]
- Lewis, I., Balogh, M., De Propris, R., et al. 2002, MNRAS, 334, 673 [NASA ADS] [CrossRef] [Google Scholar]
- Longhetti, M., Bressan, A., Chiosi, C., & Rampazzo, R. 2000, A&A, 353, 917 [NASA ADS] [Google Scholar]
- Marconi, G., Matteucci, F., & Tosi, M. 1994, MNRAS, 270, 35 [NASA ADS] [CrossRef] [Google Scholar]
- Marcolini, A., Brighenti, F., & D’Ercole, A. 2003, MNRAS, 345, 1329 [NASA ADS] [CrossRef] [Google Scholar]
- Marino, A., Rampazzo, R., Bianchi, L., et al. 2010, MNRAS, 411, 311 [Google Scholar]
- Matković, A., Guzmán, R., Sánchez-Blázquez, P., et al. 2009, ApJ, 691, 1862 [NASA ADS] [CrossRef] [Google Scholar]
- Matteucci, F., & Recchi, S. 2001, ApJ, 558, 351 [NASA ADS] [CrossRef] [Google Scholar]
- Matteucci, Book Review: The chemical evolution of the galaxy/Kluwer, 2001 [Google Scholar]
- Mayer, L., Mastropietro, C., Wadsley, J., Stadel, J., & Moore, B. 2006, MNRAS, 369, 1021 [NASA ADS] [CrossRef] [Google Scholar]
- Meurer, G. R., Wong, O. I., Kim, J. H., et al. 2009, ApJ, 695, 765 [NASA ADS] [CrossRef] [Google Scholar]
- Michielsen, D., Boselli, A., Conselice, C. J., et al. 2008, MNRAS, 385, 1374 [NASA ADS] [CrossRef] [Google Scholar]
- Moeckel, N., & Clarke, C. J. 2011, MNRAS, 410, 2799 [NASA ADS] [CrossRef] [Google Scholar]
- Monelli, M., Gallart, C., Hidalgo, S. L., et al. 2010a, ApJ, 722, 1864 [NASA ADS] [CrossRef] [Google Scholar]
- Monelli, M., Hidalgo, S. L., Stetson, P. B., et al. 2010b, ApJ, 720, 1225 [NASA ADS] [CrossRef] [Google Scholar]
- Nelan, J. E., Smith, R. J., Hudson, M. J., et al. 2005, ApJ, 632, 137 [NASA ADS] [CrossRef] [Google Scholar]
- Oemler, A. Jr. 1974, ApJ, 194, 10 [NASA ADS] [CrossRef] [Google Scholar]
- Oh, K. S., Lin, D. N. C., & Aarseth, S. J. 1995, ApJ, 442, 142 [NASA ADS] [CrossRef] [Google Scholar]
- Ott, J., Walter, F., & Brinks, E. 2005, MNRAS, 358, 1453 [NASA ADS] [CrossRef] [Google Scholar]
- Pannella, M., Gabasch, A., Goranova, Y., et al. 2009, ApJ, 701, 787 [NASA ADS] [CrossRef] [Google Scholar]
- Paudel, S., Lisker, T., Kuntschner, H., Grebel, E. K., & Glatt, K. 2010, MNRAS, 405, 800 [NASA ADS] [Google Scholar]
- Peng, C. Y., Ho, L. C., Impey, C. D., & Rix, H. 2002, AJ, 124, 266 [NASA ADS] [CrossRef] [Google Scholar]
- Peng, Y., Lilly, S. J., Kovač, K., et al. 2010, ApJ, 721, 193 [NASA ADS] [CrossRef] [Google Scholar]
- Poggianti, B. M., Bridges, T. J., Mobasher, B., et al. 2001, ApJ, 562, 689 [NASA ADS] [CrossRef] [Google Scholar]
- Poggianti, B. M., De Lucia, G., Varela, J., et al. 2010, MNRAS, 405, 995 [NASA ADS] [Google Scholar]
- Proctor, R. N., Forbes, D. A., Hau, G. K. T., et al. 2004, MNRAS, 349, 1381 [NASA ADS] [CrossRef] [Google Scholar]
- Prugniel, P., & Soubiran, C. 2001, A&A, 369, 1048 [NASA ADS] [CrossRef] [EDP Sciences] [Google Scholar]
- Rampazzo, R., Annibali, F., Bressan, A., et al. 2005, A&A, 433, 497 [NASA ADS] [CrossRef] [EDP Sciences] [Google Scholar]
- Recchi, S., Matteucci, F., & D’Ercole, A. 2001, MNRAS, 322, 800 [NASA ADS] [CrossRef] [Google Scholar]
- Reda, F. M., Proctor, R. N., Forbes, D. A., Hau, G. K. T., & Larsen, S. S. 2007, MNRAS, 377, 1772 [NASA ADS] [CrossRef] [Google Scholar]
- Reduzzi, L., & Rampazzo, R. 1995, ApLC, 30, 1 [NASA ADS] [Google Scholar]
- Rettura, A., Rosati, P., Nonino, M., et al. 2010, ApJ, 709, 512 [NASA ADS] [CrossRef] [Google Scholar]
- Robertson, B., Bullock, J. S., Font, A. S., Johnston, K. V., & Hernquist, L. 2005, ApJ, 632, 872 [NASA ADS] [CrossRef] [Google Scholar]
- Rubin, V. C., Whitmore, B. C., & Ford, W. K. Jr. 1988, ApJ, 333, 522 [NASA ADS] [CrossRef] [Google Scholar]
- Sánchez-Blázquez, P., Gorgas, J., Cardiel, N., & González, J. J. 2006, A&A, 457, 809 [NASA ADS] [CrossRef] [EDP Sciences] [Google Scholar]
- Schechter, P. 1976, ApJ, 203, 297 [Google Scholar]
- Searle, L., & Zinn, R. 1978, ApJ, 225, 357 [NASA ADS] [CrossRef] [Google Scholar]
- Smith, R. J., Marzke, R. O., Hornschemeier, A. E., et al. 2008, MNRAS, 386, L96 [NASA ADS] [CrossRef] [Google Scholar]
- Smith, R. J., Lucey, J. R., Hudson, M. J., et al. 2009, MNRAS, 392, 1265 [NASA ADS] [CrossRef] [Google Scholar]
- Spolaor, M., Kobayashi, C., Forbes, D. A., Couch, W. J., & Hau, G. K. T. 2010, MNRAS, 408, 272 [NASA ADS] [CrossRef] [Google Scholar]
- Tasca, L. A. M., Kneib, J.-P., Iovino, A., et al. 2009, A&A, 503, 379 [NASA ADS] [CrossRef] [EDP Sciences] [Google Scholar]
- Thomas, D., Maraston, C., & Bender, R. 2003, MNRAS, 339, 89 [Google Scholar]
- Thomas, D., Maraston, C., Bender, R., & Mendes de Oliveira, C. 2005, ApJ., 621, 673 [NASA ADS] [CrossRef] [Google Scholar]
- Thomas, D., Maraston, C., Schawinski, K., Sarzi, M., & Silk, J. 2010, MNRAS, 404, 1775 [NASA ADS] [Google Scholar]
- Toloba, E., Boselli, A., Gorgas, J., et al. 2009, ApJ, 707, L17 [NASA ADS] [CrossRef] [Google Scholar]
- Tolstoy, E., Hill, V., & Tosi, M. 2009, ARA&A, 47, 371 [NASA ADS] [CrossRef] [Google Scholar]
- Tornambé, A., & Matteucci, F. 1986, MNRAS, 223, 69 [NASA ADS] [Google Scholar]
- Trager, S. C., Worthey, G., Faber, S. M., Burstein, D., & González, J. J., 1998, ApJS, 116, 1 [NASA ADS] [CrossRef] [MathSciNet] [Google Scholar]
- Trager, S. C., Faber, S. M., Worthey, G., & González, J. J. 2000, AJ, 119, 1645 [NASA ADS] [CrossRef] [Google Scholar]
- Trinchieri, G., & Rampazzo, R., 2001, AA, 374, 454 [NASA ADS] [CrossRef] [EDP Sciences] [Google Scholar]
- Trujillo, I., Burkert, A., & Bell, E. F. 2004, ApJ, 600, L39 [NASA ADS] [CrossRef] [Google Scholar]
- Tully, R. B. 1988a, Nearby Galaxy Catalogue (Cambridge University Press) [Google Scholar]
- Tully, R. B. 1988b, AJ, 96, 73 [NASA ADS] [CrossRef] [Google Scholar]
- van Dokkum, P. G., & van der Marel, R. P. 2007, ApJ, 655, 30 [NASA ADS] [CrossRef] [Google Scholar]
- van Zee, L., Barton, E. J., & Skillman, E. D. 2004, AJ, 128, 2797 [NASA ADS] [CrossRef] [Google Scholar]
- White, S. D. M., & Rees, M. J. 1978, MNRAS, 183, 341 [NASA ADS] [CrossRef] [Google Scholar]
- Worthey, G., & Ottaviani, D. L. 1997, ApJS, 111, 377 [NASA ADS] [CrossRef] [Google Scholar]
- Worthey, G., Faber, S. M., Gonzalez, J. J., & Burstein, D. 1994, ApJS, 94, 687 [NASA ADS] [CrossRef] [Google Scholar]
Appendix A:
We give in Table A.1 the ages, metallicities, and [α/Fe] ratios derived for Coma dwarfs reprocessing the Hβ, Fe5270, Fe5335, and Mgb indices provided by Smith et al. (2009) with our own procedure (see Sect. 3.2).
Stellar population parameters for Coma dwarfs.
All Tables
All Figures
|
Fig. 1 Lick indices (Hβ vs. [MgFe]′, left panels, and Mgb vs. [MgFe]′, right panels) extracted at r < re/2 for the dwarf sample. From top to bottom, the galaxies were separated according to their group membership: RR143, RR210, RR216, and RR242. For RR242_13326, [MgFe]′ is a lower limit. The data are compared with SSP models of metallicities Z = 0.0004, 0.004, 0.008, 0.02, 0.05, ages = 13, 9, 6, 5, 4, 3, 2, 1.5 Gyr, and [α/Fe] = –0.4, 0., 0.4. |
| In the text | |
|
Fig. 2 Ages, metallicities, and [α/Fe] ratios at r < re/2 versus velocity dispersion. Different symbols indicate the group membership. For comparison, we also plot the stellar population parameters for a selection of galaxies from the bright ETGs of A07 (open triangles, see text for details). The solid line indicates the least-square linear fit to the (dwarf + giant) ETG sample, where we have excluded the Sc galaxy RR216_12209 (big open circle), and the two low quality-fit galaxies (see Sect. 3.2 for details): RR143_09192 (big open square) and RR242_36267 (big filled circle). The dashed and dotted lines are the separate fits to the dwarf (σre/2 < 100 km s-1) and giant (σre/2 ≥ 100 km s-1) samples, respectively. The slope (α), zero-point (β), and scatter of the fits are indicated in the panels. |
| In the text | |
|
Fig. 3 Stellar population parameters (ages, metallicities, and [α/Fe] ratios) as a function of morphology. Left panel: bulge fraction B/T; right panel: Sersic index n. Different symbols indicate the group membership: RR 210 (blue triangles), RR 216 (black open circles), and RR 242 (red full dots). We use larger symbols to indicate the Sc galaxy RR216_12209 (open circle) and the low-quality fit galaxy RR242_36267 (filled circle). |
| In the text | |
|
Fig. 4 Velocity dispersion σ, age, metallicity and [α/Fe] ratio as a function of the Sersic index n. Full dots are the early-type dwarfs of this paper, while open triangles are the bright ETGs selected from A07 (see text for details). We excluded RR143_09192 and RR242_36267, for which we obtain a low-quality fit (see Sect. 3.2), and RR216_12209, which is classified as an Sc. |
| In the text | |
|
Fig. 5 Stellar population parameters as a function of surface local density. From top to bottom: age, metallicity, and [α/Fe] ratio. The symbols are the same as in Fig. 2. |
| In the text | |
|
Fig. 6 Age, metallicity, and [α/Fe] ratio versus σ. Open circles are the Coma dwarfs from Smith et al. (2009), filled circles are the low-density environment (LDE) dwarfs of this paper (we have excluded RR143_09192 and RR242_36267, which have a poor quality SSP fit, see Sect. 3.2, and RR216_12209, which is an Sc), while open triangles are the ETGs of A07. The solid and dotted lines are the least square linear fits to the (Coma dwarfs + A07) and (LDE dwarfs + A07) samples, respectively. |
| In the text | |
|
Fig. 7 Age, metallicity, and [α/Fe] distributions for our early-type dwarfs and for red passive dwarfs in a field centered on the Coma core. All galaxies were selected to have σ in the range 40–70 km s-1. Vertical arrows indicate the median values for the two samples. Within our sample, we did not include RR143_09192 and RR242_36267, which have a poor quality SSP fit (see Sect. 3.2), and the Sc galaxy RR216_12209. |
| In the text | |
Current usage metrics show cumulative count of Article Views (full-text article views including HTML views, PDF and ePub downloads, according to the available data) and Abstracts Views on Vision4Press platform.
Data correspond to usage on the plateform after 2015. The current usage metrics is available 48-96 hours after online publication and is updated daily on week days.
Initial download of the metrics may take a while.