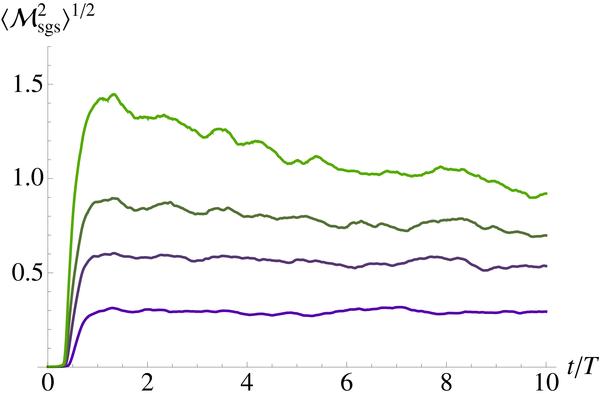
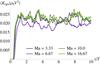
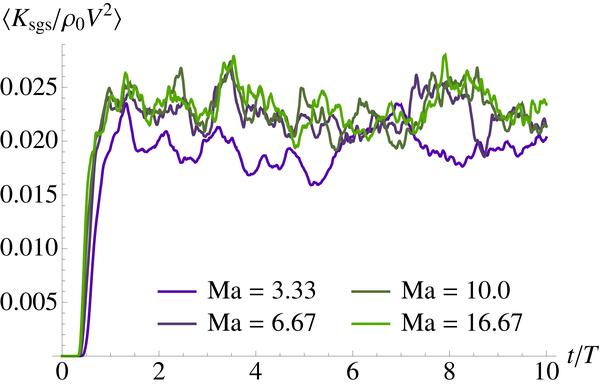
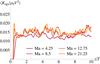
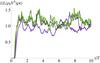
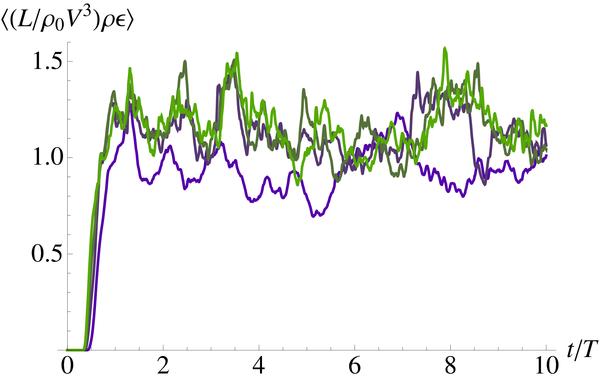
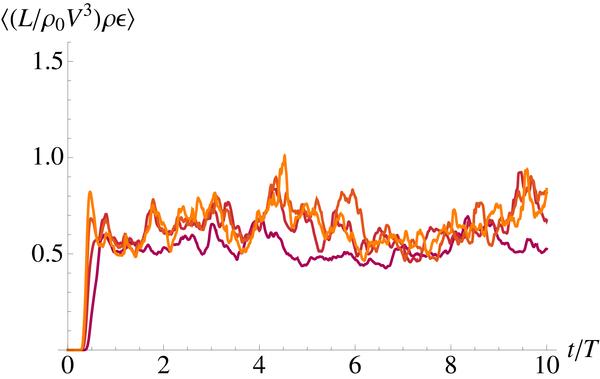
Fig. 16
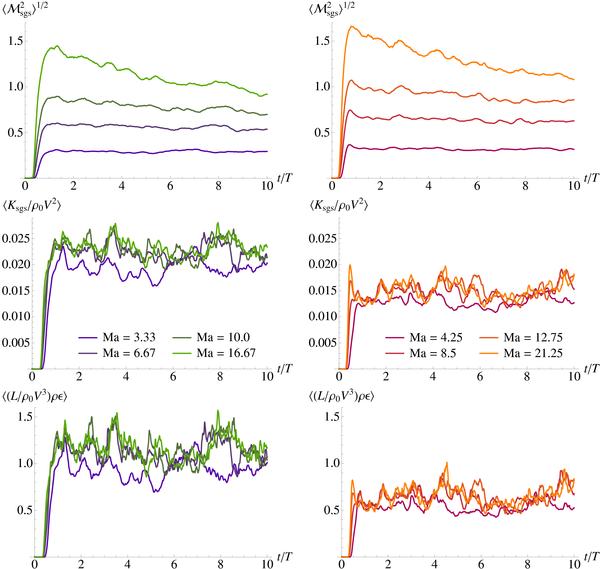
Temporal evolution of the SGS turbulence Mach number (top) and energy (middle) and the dissipation rate (bottom) for ζ = 2/3 (left column) and ζ = 1/3 (right column). The different lines in each plot correspond to different forcing magnitudes (see Table 5), which are specified by the values of the characteristic Mach number Ma = V/c0 (c0 is the initial speed of sound).


Current usage metrics show cumulative count of Article Views (full-text article views including HTML views, PDF and ePub downloads, according to the available data) and Abstracts Views on Vision4Press platform.
Data correspond to usage on the plateform after 2015. The current usage metrics is available 48-96 hours after online publication and is updated daily on week days.
Initial download of the metrics may take a while.