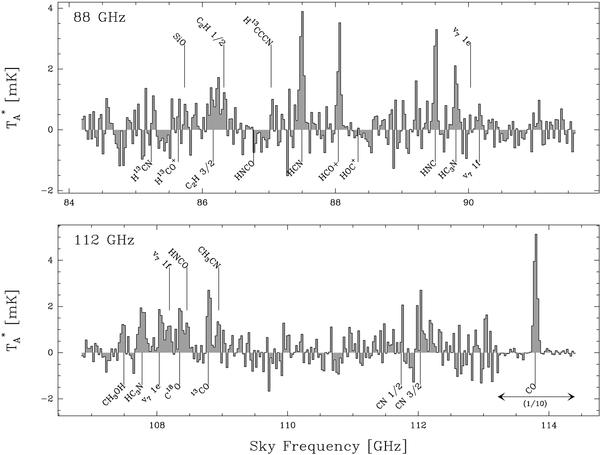
Fig. 2

Spectra observed with EMIR in IC 860 at 88 and 112 GHz. The intensity scale is in  , not corrected for main beam efficiency. The region marked with (1 / 10), around the CO 1–0 line, has been scaled down by a factor 10. The main molecular transitions are labelled regardless of line detection. The C2H 3/2 and 1/2 labels mark the limits of the C2H multiplet at 87 GHz. Transitions of vibrationally excited HC3N are labelled as v71e and v71f. The frequency scale is the observed frequency, not corrected for redshift.
Current usage metrics show cumulative count of Article Views (full-text article views including HTML views, PDF and ePub downloads, according to the available data) and Abstracts Views on Vision4Press platform.
Data correspond to usage on the plateform after 2015. The current usage metrics is available 48-96 hours after online publication and is updated daily on week days.
Initial download of the metrics may take a while.


