Fig. 4
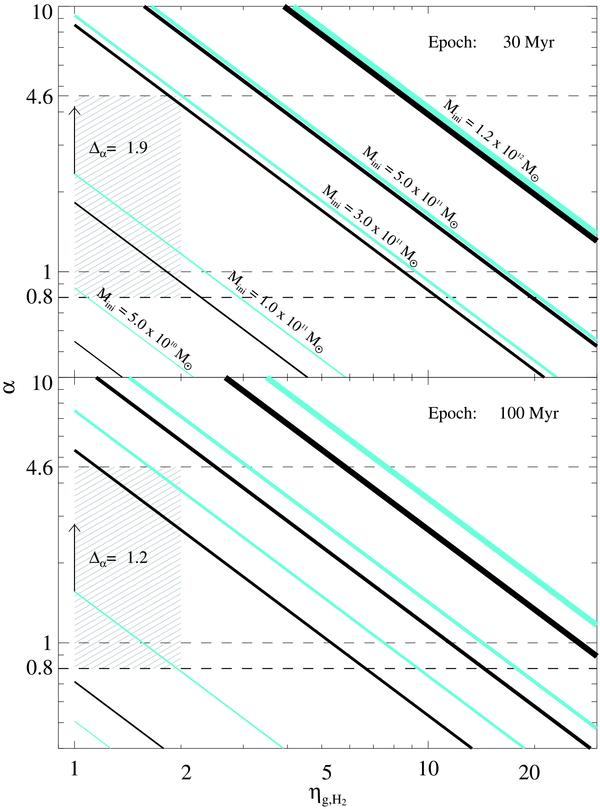
CO conversion factor versus gas-to-H2 ratio at epochs 30 Myr
(top panel) and 100 Myr (bottom panel). The
solid lines correspond to calculations of α as a function of the
gas-to-H2 ratio
ηg,H2 for a CO line
luminosity of  K km s-1 pc2.
Calculations are performed for different IMFs and galaxies for a range of different
initial gas masses Mini. The thickness of the lines is
scaled by Mini as indicated in the upper panel. The
black and cyan colors denote the Salpeter and top-heavy IMF, respectively. The arrow
indicates the shift of α for calculations with the lower
K km s-1 pc2.
Calculations are performed for different IMFs and galaxies for a range of different
initial gas masses Mini. The thickness of the lines is
scaled by Mini as indicated in the upper panel. The
black and cyan colors denote the Salpeter and top-heavy IMF, respectively. The arrow
indicates the shift of α for calculations with the lower
 K km s-1 pc2,
and Δα is the difference of α between
the higher and lower
K km s-1 pc2,
and Δα is the difference of α between
the higher and lower  .
Calculations are shown for models with
ψini = 3 × 10³ M⊙
yr-1, except for the model for the most massive galaxy for which
ψini =
104 M⊙ yr-1. The grey shaded
region signifies the possible range of α and
ηg,H2. The horizontal
black dashed lines mark the values of α = 0.8, 1 and
4.6 M⊙ (K km s-1 pc2)-1.
.
Calculations are shown for models with
ψini = 3 × 10³ M⊙
yr-1, except for the model for the most massive galaxy for which
ψini =
104 M⊙ yr-1. The grey shaded
region signifies the possible range of α and
ηg,H2. The horizontal
black dashed lines mark the values of α = 0.8, 1 and
4.6 M⊙ (K km s-1 pc2)-1.
Current usage metrics show cumulative count of Article Views (full-text article views including HTML views, PDF and ePub downloads, according to the available data) and Abstracts Views on Vision4Press platform.
Data correspond to usage on the plateform after 2015. The current usage metrics is available 48-96 hours after online publication and is updated daily on week days.
Initial download of the metrics may take a while.