Fig. 3
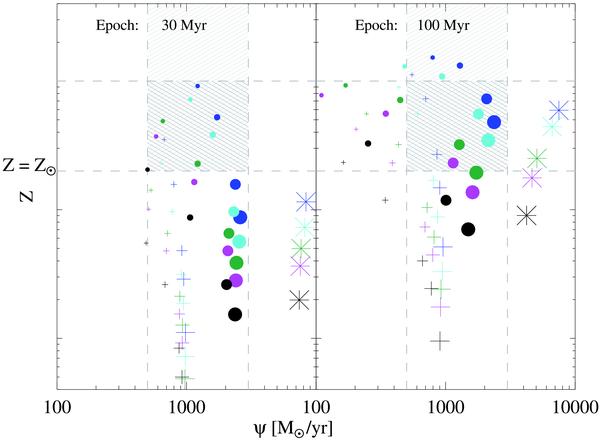
Relation between metallicity and SFR at epochs of 30 Myr (left panel) and 100 Myr (right panel). The colored symbols are obtained for different initial gas masses, Mini, SFRs, and IMFs. The size of the symbols is scaled by Mini. Calculations are made for Mini = 1.3 × 10¹² M⊙ (largest symbol), Mini = 5 × 10¹¹ M⊙, Mini = 3 × 10¹¹ M⊙, Mini = 1 × 10¹¹ M⊙, and Mini = 5 × 10¹⁰ M⊙ (smallest symbol). The crosses correspond to calculations for a initial SFR ψini = 103 M⊙ yr-1, the filled circles to ψini = 3 × 10³ M⊙ yr-1 and the stars to ψini = 104 M⊙ yr-1. The black, green, cyan, magenta, and blue colors denote the Salpeter, mass-heavy, top-heavy, Larson 1, and Larson 2 IMF, respectively. The dark grey shaded region indicates the range of the metallicity and SFR based on observations of QSOs at z > 6. The vertical dashed lines represent the lower and upper limits of the observationally derived SFRs. The light grey shaded area accounts for the uncertainty of the upper limit of the metallicity. The horizontal dashed lines mark the lower and possibly upper limit of the metallicity.
Current usage metrics show cumulative count of Article Views (full-text article views including HTML views, PDF and ePub downloads, according to the available data) and Abstracts Views on Vision4Press platform.
Data correspond to usage on the plateform after 2015. The current usage metrics is available 48-96 hours after online publication and is updated daily on week days.
Initial download of the metrics may take a while.