Fig. 1
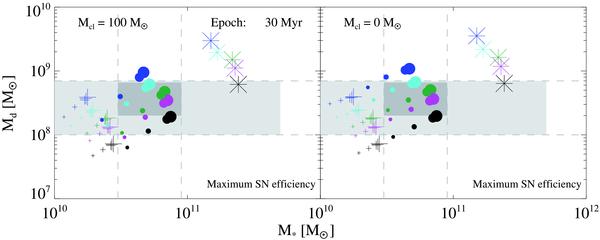
Relation between dust mass and stellar mass at an epoch of 30 Myr, for various initial gas masses and IMFs. Calculations are performed for a “maximum” SN efficiency and dust destruction in the ISM with Mcl = 100 M⊙ (left panel) and Mcl = 0 (right panel). The colored symbols are obtained for different initial gas masses, Mini, SFRs, and IMFs. The size of the symbols is scaled by Mini. Calculations are made for Mini = 1.3 × 10¹² M⊙ (largest symbol), Mini = 5 × 10¹¹ M⊙, Mini = 3 × 10¹¹ M⊙, Mini = 1 × 10¹¹ M⊙, and Mini = 5 × 10¹⁰ M⊙ (smallest symbol). The crosses correspond to calculations for a initial SFR ψini = 103 M⊙ yr-1, the filled circles to ψini = 3 × 10³ M⊙ yr-1, and the stars to ψini = 104 M⊙ yr-1. The black, green, cyan, magenta, and blue colors denote the Salpeter, mass-heavy, top-heavy, Larson 1, and Larson 2 IMF, respectively. The dark grey region indicates the mass range of stellar masses and dust masses derived from observations of QSOs at z > 6. The vertical dashed lines represent the lower and upper limits of the observed stellar masses. The light grey area illustrates the whole mass ranges derived from observations of QSOs > 5 and accounts for uncertainties in the derived quantities. The horizontal dashed lines mark the lower and upper mass limit of the derived dust masses.
Current usage metrics show cumulative count of Article Views (full-text article views including HTML views, PDF and ePub downloads, according to the available data) and Abstracts Views on Vision4Press platform.
Data correspond to usage on the plateform after 2015. The current usage metrics is available 48-96 hours after online publication and is updated daily on week days.
Initial download of the metrics may take a while.