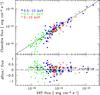
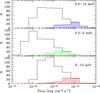
Fig. 9

Left top panel: the CDFS Chandra source fluxes vs. the XRT counterpart fluxes in the three energy band: 0.5–10 keV (blue solid dots), 2–10 keV (red open dots) and 0.5–2 keV (green solid squares). The solid line is the exact match between the Chandra and XRT fluxes. Left bottom panel: ratio between the relative difference of the XRT and Chandra fluxes vs. the XRT fluxes. The dashed line indicates the exact match between the Chandra and XRT fluxes, the stars are the mean ratios in each flux bin, with 1σ uncertainties. Right panel: the empty histogram represents the flux distribution of the Chandra sources and the shaded histogram represents the flux distribution of the Chandra sources with an XRT counterpart, in the three energy band: 0.5–10 keV, 0.5–2 keV, 2–10 keV.
Current usage metrics show cumulative count of Article Views (full-text article views including HTML views, PDF and ePub downloads, according to the available data) and Abstracts Views on Vision4Press platform.
Data correspond to usage on the plateform after 2015. The current usage metrics is available 48-96 hours after online publication and is updated daily on week days.
Initial download of the metrics may take a while.