Fig. 13
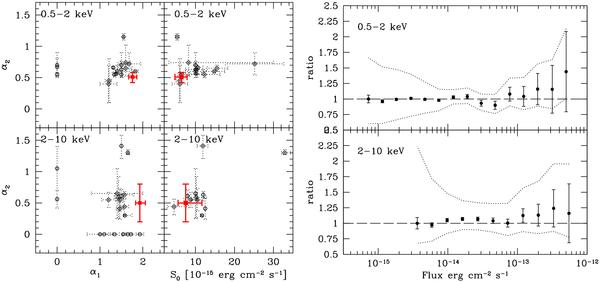
Left panel: faint spectral index α2 vs. the bright spectral index α1 for the 0.5–2 keV band and for the 2–10 keV band in the left top and left bottom panel, respectively, and faint spectral index α2 vs. the flux break S0 for the 0.5–2 keV band and for the 2–10 keV band in the right top and right bottom panel, respectively (see text for the definition of α1, α2 and S0). The red solid squares are our results for broken power law model, and the black open dots represents a compilation of data from literature: Hasinger et al. (1993), Giommi et al. (2000), Mushotzky et al. (2000), Page et al. (2000), Brandt et al. (2001), Baldi et al. (2002), Cowie et al. (2002), Rosati et al. (2002), Harrison et al. (2003), Moretti et al. (2003), Bauer et al. (2004), Kim et al. (2004), Yang et al. (2004), Hasinger et al. (2005), Kenter et al. (2005), Cappelluti et al. (2007), Brunner et al. (2008), Carrera et al. (2007), Mateos et al. (2008), Ueda et al. (2008), Cappelluti et al. (2009). Right panel: ratio between the binned integral log N–log S and the best fit model in the 0.5–2 keV band (upper panel) and 2–10 keV band (bottom panel). The dotted lines are the ratio between the binned integral log N–log S and predicted 1-σ uncertainty interval.
Current usage metrics show cumulative count of Article Views (full-text article views including HTML views, PDF and ePub downloads, according to the available data) and Abstracts Views on Vision4Press platform.
Data correspond to usage on the plateform after 2015. The current usage metrics is available 48-96 hours after online publication and is updated daily on week days.
Initial download of the metrics may take a while.