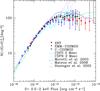
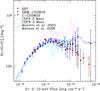
Fig. 12

Cumulative number counts normalized to the Euclidean slope (multiplied by S ) for HGL sample with detection significance level ≤ 2 × 10⁻⁵ in the soft band (0.5–2 keV, red filled circles, left panel) and in the hard band (2–10 keV, red filled circles, right panel). Other symbols represent: the C-COSMOS curve (blue open circles, Elvis et al. 2009), the XMM-COSMOS curve (black filled squares, Cappelluti et al. 2009), the Moretti et al. (2003) compilation (blue dashed line), the soft band curve of Hasinger et al. (2005; green dashed line), the CDF-N (magenta dotted line, Alexander et al. 2003) and the CDF-S (cyan solid line, Luo et al. 2008) curves, the Mateos et al. (2008) compilation (cyan solid triangles).
Current usage metrics show cumulative count of Article Views (full-text article views including HTML views, PDF and ePub downloads, according to the available data) and Abstracts Views on Vision4Press platform.
Data correspond to usage on the plateform after 2015. The current usage metrics is available 48-96 hours after online publication and is updated daily on week days.
Initial download of the metrics may take a while.