Free Access
Fig. 9
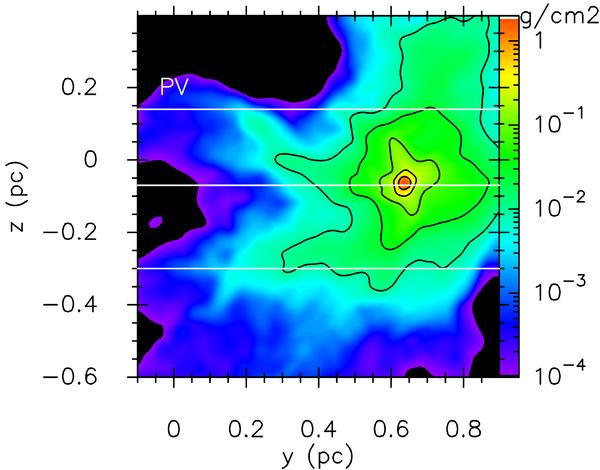
Total column density for the purely along the line of sight turbulent run, CT. Unlike runs A and B, we find a low-density region in the north (large z), because with this orientation we see regions that have not collided. The contour levels are as in Fig. 5.
Current usage metrics show cumulative count of Article Views (full-text article views including HTML views, PDF and ePub downloads, according to the available data) and Abstracts Views on Vision4Press platform.
Data correspond to usage on the plateform after 2015. The current usage metrics is available 48-96 hours after online publication and is updated daily on week days.
Initial download of the metrics may take a while.