Fig. 6
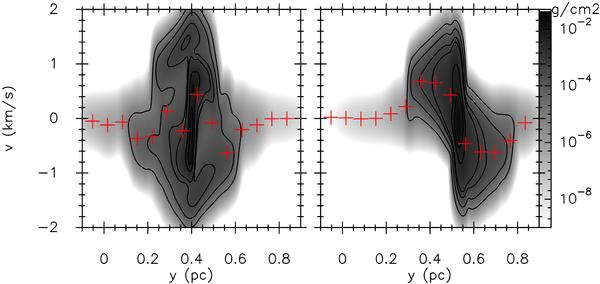
Position-velocity diagram at z = −0.02pc (colour scale and contours) for the non-turbulent direct and offset runs, Anon−T and Bnon−T, left and right respectively. The displayed velocity corresponds to the component along the line of sight. Contours at 10-5, 10-4, 5 × 10⁻⁴, 10-3, 5 × 10⁻³, 10-2 and 3 × 10⁻² g cm-2. The red crosses represent the column density weighted velocities and are plotted as an auxiliary tool to see the velocity changes along the diagram. Note that the velocities from the direct collision (left) in the central region seem to be more complex than those observed (Fig. 2lower panel), whereas those from the offset collision (right) show a smooth shift in velocities from one component to another, likely because in the offset collision we see the parts of the clouds that do not collide more clearly.
Current usage metrics show cumulative count of Article Views (full-text article views including HTML views, PDF and ePub downloads, according to the available data) and Abstracts Views on Vision4Press platform.
Data correspond to usage on the plateform after 2015. The current usage metrics is available 48-96 hours after online publication and is updated daily on week days.
Initial download of the metrics may take a while.