Fig. 5
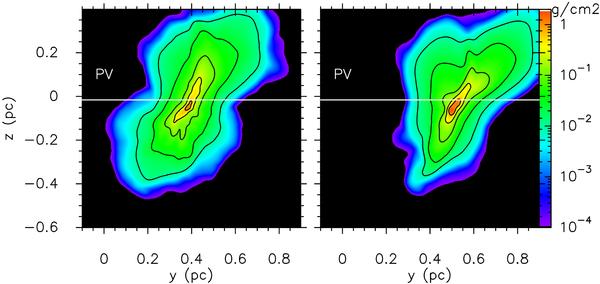
Colour scale and contours of the total column density along the line of sight for the non-turbulent runs: the centred collision, Anon−T, on the left; and off-centred collision, Bnon−T, on the right. The contour levels are 0.01, 0.03, 0.1, 0.3 and 0.5 g cm-2 for both figures. The white horizontal lines show the cuts for the PV diagrams in Fig. 6.
Current usage metrics show cumulative count of Article Views (full-text article views including HTML views, PDF and ePub downloads, according to the available data) and Abstracts Views on Vision4Press platform.
Data correspond to usage on the plateform after 2015. The current usage metrics is available 48-96 hours after online publication and is updated daily on week days.
Initial download of the metrics may take a while.