Fig. 3
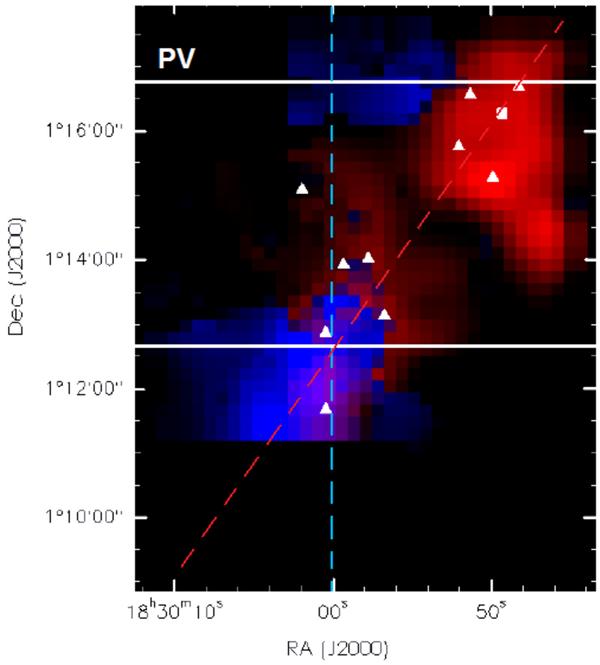
C18O J = 1 → 0 emission separated into blue and red components, using the line fitting and splitting by Duarte-Cabral et al. (2010). The blue emission corresponds to the total integrated intensity of the low-velocity cloud and the red emission corresponds to the high-velocity cloud. The submillimetre sources from the 850 μm emission (Davis et al. 1999) are marked with white triangles and serve as a guide to the location of the dust emission. The positions of the PV diagrams in Fig. 2 are shown by the white solid lines, and the main axis of the blue-shifted and red-shifted cloud is shown as blue and red dashed line, respectively.
Current usage metrics show cumulative count of Article Views (full-text article views including HTML views, PDF and ePub downloads, according to the available data) and Abstracts Views on Vision4Press platform.
Data correspond to usage on the plateform after 2015. The current usage metrics is available 48-96 hours after online publication and is updated daily on week days.
Initial download of the metrics may take a while.