Fig. 2
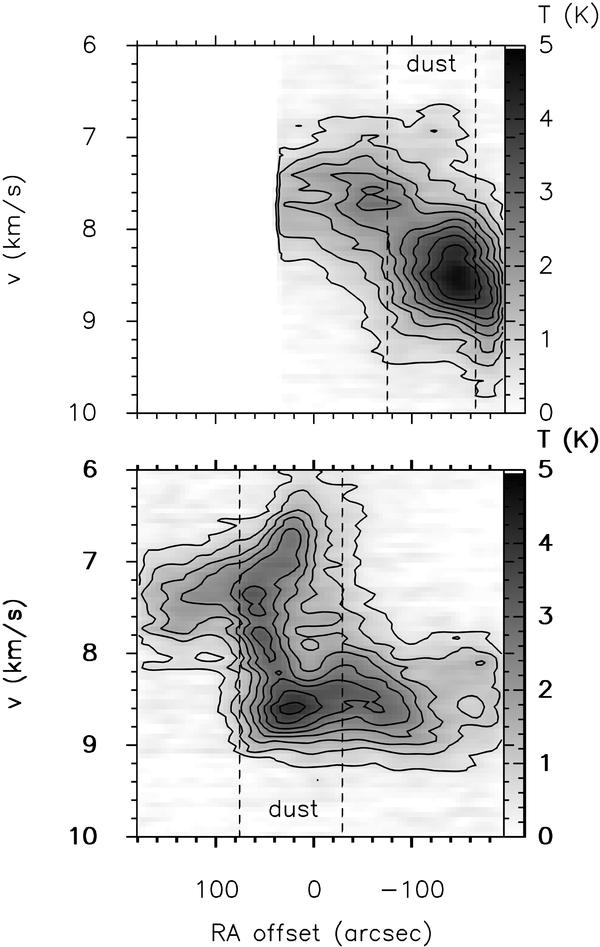
Position-velocity diagrams at constant declination of C18O J = 1 → 0 (grey scale and contours) as examples of the typical velocity structure in the NW sub-cluster (top) and the SE sub-cluster (bottom) (Duarte-Cabral et al. 2010). Right ascension varies from 18h30m06s to 18h29m46s for all panels. Declinations are 1°16′48′′ (top panel) and 1°12′38′′ (lower panel). The positions of these cuts in the map are shown as white lines in Fig. 3. The dashed lanes labelled as “dust” represent the regions whose 850 μm emission is above 0.6 Jy beam-1.
Current usage metrics show cumulative count of Article Views (full-text article views including HTML views, PDF and ePub downloads, according to the available data) and Abstracts Views on Vision4Press platform.
Data correspond to usage on the plateform after 2015. The current usage metrics is available 48-96 hours after online publication and is updated daily on week days.
Initial download of the metrics may take a while.