Free Access
Fig. A.4
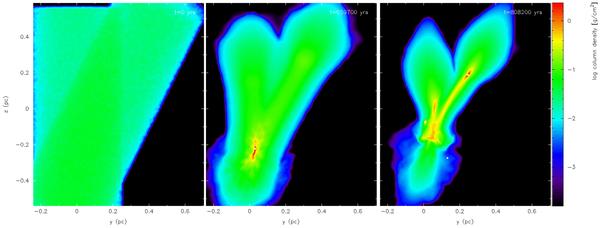
Three time snapshots of the total column density along the line of sight for Dnon−T. The three frames are at the beginning of the simulation (left), when the first sink particle forms in the south (middle) and when a sink particle is formed in the north (right).
Current usage metrics show cumulative count of Article Views (full-text article views including HTML views, PDF and ePub downloads, according to the available data) and Abstracts Views on Vision4Press platform.
Data correspond to usage on the plateform after 2015. The current usage metrics is available 48-96 hours after online publication and is updated daily on week days.
Initial download of the metrics may take a while.