Fig. 13
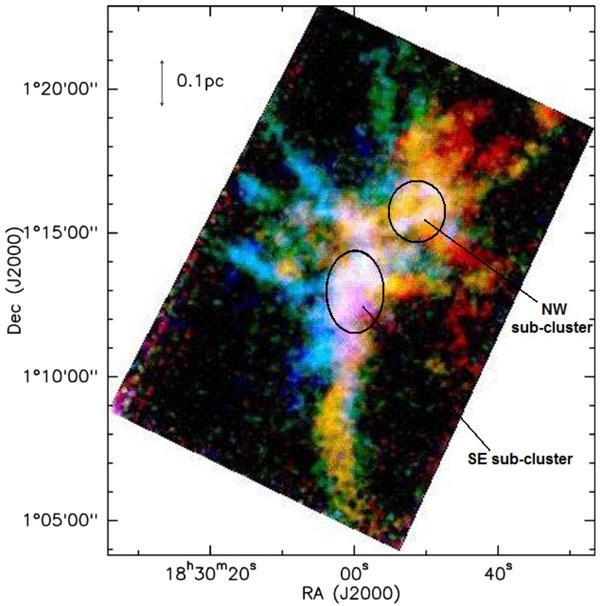
Velocity-coded 3-colour plot of Serpens from the C18O J = 3 → 2 data from the JCMT GBS. Each colour represents the maximum value in the velocity intervals: blue: 5 → 7.7 km s-1; green: 7.7 → 8.3 km s-1; and red: 8.3 → 11 km s-1 (see also Graves et al. 2010). The two sub-clusters of Serpens are indicated by the black ellipses.
Current usage metrics show cumulative count of Article Views (full-text article views including HTML views, PDF and ePub downloads, according to the available data) and Abstracts Views on Vision4Press platform.
Data correspond to usage on the plateform after 2015. The current usage metrics is available 48-96 hours after online publication and is updated daily on week days.
Initial download of the metrics may take a while.