Fig. 10
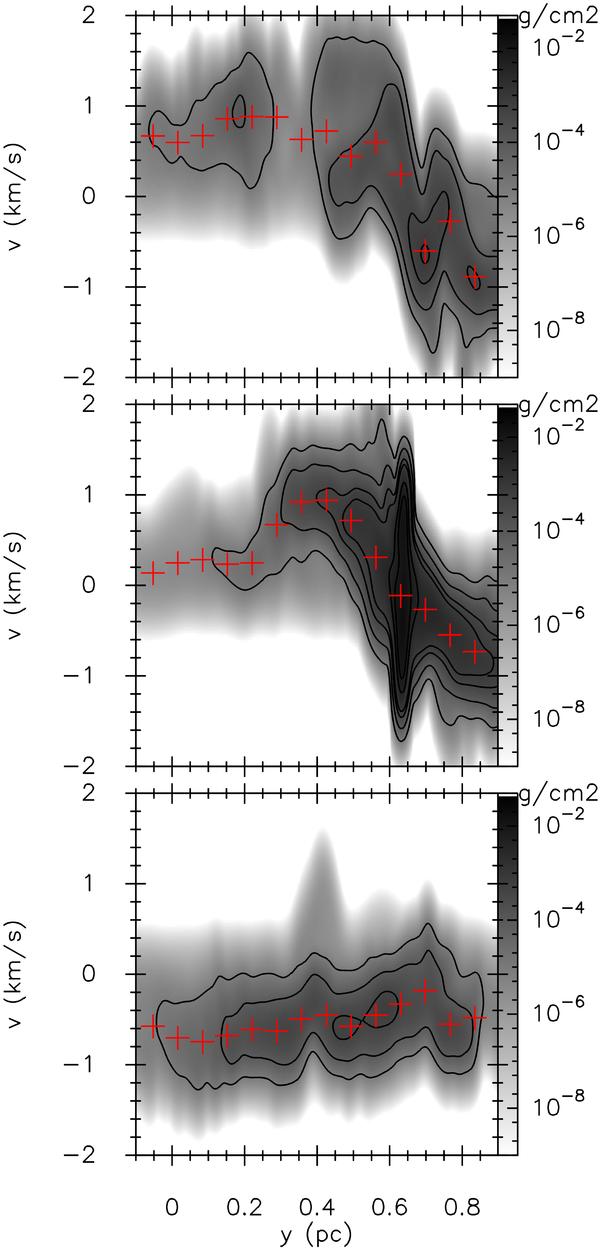
Position-velocity diagram in colour scale and contours, at z = 0.14 pc (top), z = −0.07 pc (middle) and z = −0.30 pc (bottom), for the turbulent, line of sight, short cylinders run CT. The contour levels and red crosses are as in Fig. 6. Compared with model BT (Fig. 8 right column), we see more evidence of the original velocities of the clouds from the non-interacting parts, because of the change of perspective. This calculation produces the best fit to the observations (Fig. 2).
Current usage metrics show cumulative count of Article Views (full-text article views including HTML views, PDF and ePub downloads, according to the available data) and Abstracts Views on Vision4Press platform.
Data correspond to usage on the plateform after 2015. The current usage metrics is available 48-96 hours after online publication and is updated daily on week days.
Initial download of the metrics may take a while.