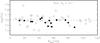
Fig. 7
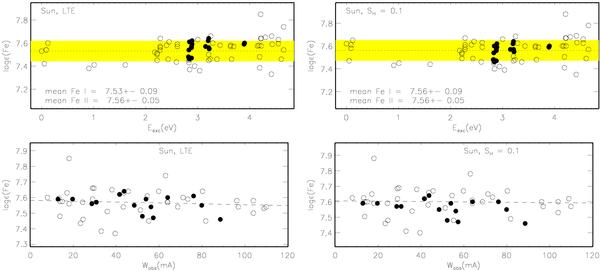
Solar LTE (left column) and non-LTE (SH = 0.1, right column) Fe abundances from the Fe i (open circles) and Fe ii (filled circles) lines plotted as a function of Eexc (top row) and Wobs (bottom row). The mean abundances derived from the Fe i and Fe ii lines along with their standard deviations are quoted in the top row panels. The dotted line indicates the mean abundance derived from the Fe i lines and the shaded grey area its statistical error. In the bottom row panels, the dashed line shows the calculated trend of log εFeI versus Wobs. Everywhere, gf-values indicated in Table 5 were used.
Current usage metrics show cumulative count of Article Views (full-text article views including HTML views, PDF and ePub downloads, according to the available data) and Abstracts Views on Vision4Press platform.
Data correspond to usage on the plateform after 2015. The current usage metrics is available 48-96 hours after online publication and is updated daily on week days.
Initial download of the metrics may take a while.