Fig. 6
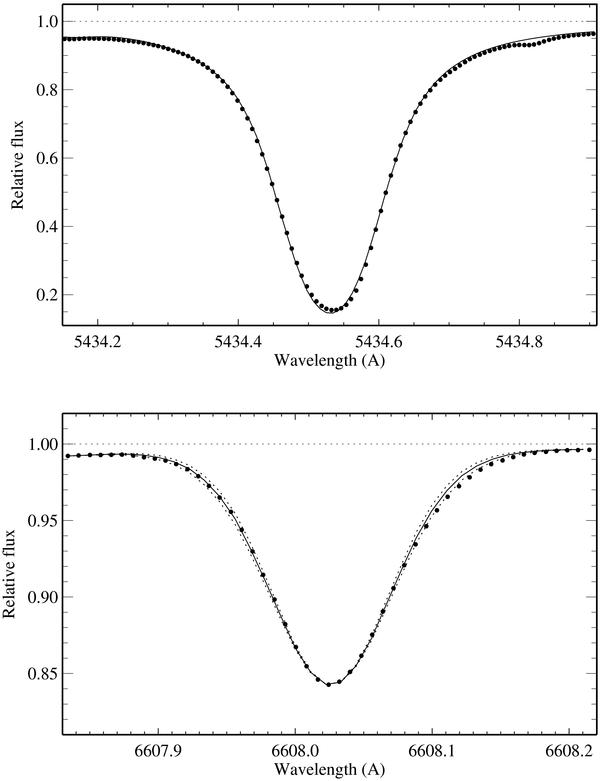
Best fits (continuous curve) of the solar Fe i 5434 and 6608 Å lines (bold dots in top and bottom panels, respectively) obtained from the non-LTE calculations with SH = 0.1. Fitting parameters are given in Table 5. For Fe i 6608 Å, dotted curves show the effect on the theoretical profile of a ± 0.02 dex variation in the final Fe abundance. The macroturbulence velocity was reduced by 0.3 km s-1 for  dex and increased by 0.2 km s-1 for
  dex. The bottom panel illustrates that the errors caused by an abundance variation in fitting the solar iron line profiles are small.
Current usage metrics show cumulative count of Article Views (full-text article views including HTML views, PDF and ePub downloads, according to the available data) and Abstracts Views on Vision4Press platform.
Data correspond to usage on the plateform after 2015. The current usage metrics is available 48-96 hours after online publication and is updated daily on week days.
Initial download of the metrics may take a while.