Fig. 7
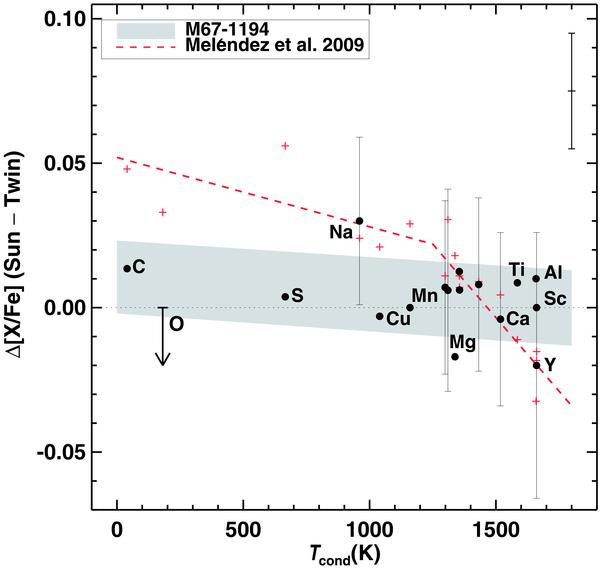
Abundance difference as a function of condensation temperature (according to Lodders 2003). Filled circles: this paper, plus signs: Meléndez et al. (2009). Shaded area: this paper, dotted line: Meléndez et al. (2009). The shaded area summarizes the result of this paper when submitted to a linear-regression analysis (including the upper limit of O), giving Δ [X/Fe] = a + mTcond. The area delineates the range of regression lines due to the uncertainties in a and m. The elements in the range 1300–1500 K not identified are (from left to right): Cr, Si, Co, Ni and V. Error bars are discussed in detail in Sect. 3.2.
Current usage metrics show cumulative count of Article Views (full-text article views including HTML views, PDF and ePub downloads, according to the available data) and Abstracts Views on Vision4Press platform.
Data correspond to usage on the plateform after 2015. The current usage metrics is available 48-96 hours after online publication and is updated daily on week days.
Initial download of the metrics may take a while.