Free Access
Fig. 4
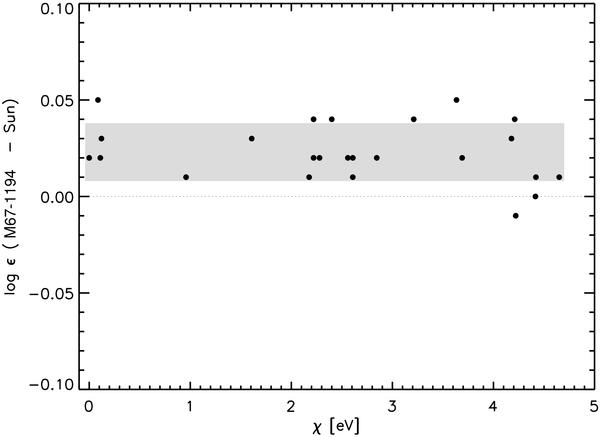
The line-by-line difference in Fe i abundance plotted as a function of the excitation energy of each line. A slope insignificantly different from zero is found, suggesting an effective temperature close to 5780 K. The standard deviation is indicated by the grey-shaded area.
Current usage metrics show cumulative count of Article Views (full-text article views including HTML views, PDF and ePub downloads, according to the available data) and Abstracts Views on Vision4Press platform.
Data correspond to usage on the plateform after 2015. The current usage metrics is available 48-96 hours after online publication and is updated daily on week days.
Initial download of the metrics may take a while.