Fig. 10
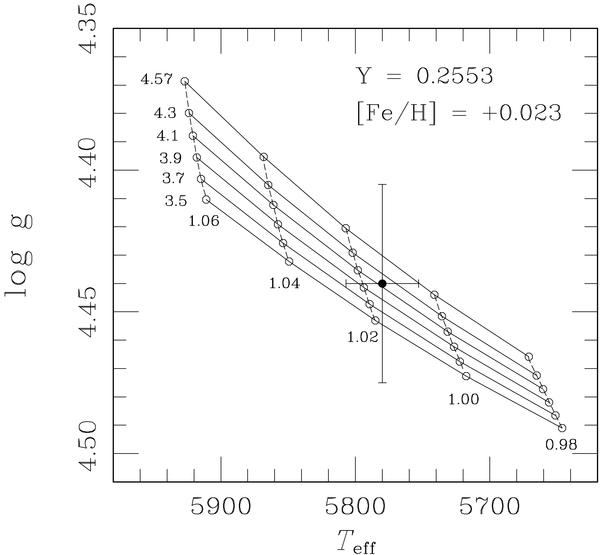
Plot of the 3.5 to 4.57 Gyr segments of the post-main-sequence tracks (dashed) that were computed for masses from 0.98 to 1.06 ℳ⊙ (indicated below each track) and the indicated values of Y and [Fe/H]. Open circles represent the Teff and log g values at the ages noted just to the right of the y-axis; and hence the solid curves are isochrones for those ages. The filled circle and attached error bars indicate the location of the solar twin, M67-1194.
Current usage metrics show cumulative count of Article Views (full-text article views including HTML views, PDF and ePub downloads, according to the available data) and Abstracts Views on Vision4Press platform.
Data correspond to usage on the plateform after 2015. The current usage metrics is available 48-96 hours after online publication and is updated daily on week days.
Initial download of the metrics may take a while.