Fig. 3
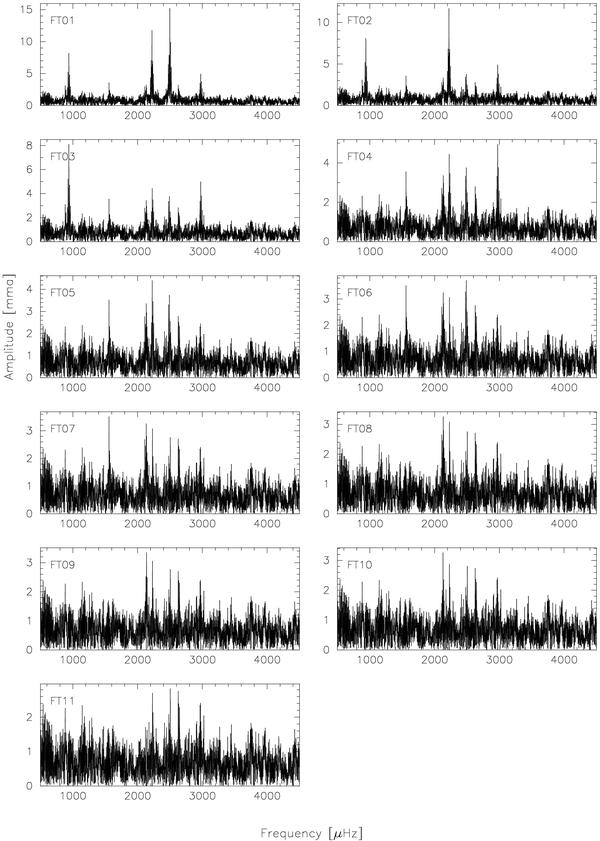
Illustration of the prewhitening process on the 2005 amplitude spectrum. The first panel (FT01) is the full amplitude spectrum as shown in Fig. 2. Panel FT02 shows the amplitude spectrum after subtraction of the largest amplitude peak at 2497 μHz. The next panel (FT03) shows the amplitude spectrum after additional subtraction of the next largest amplitude peak at 2221 μHz, and so on for the subsequent panels.
Current usage metrics show cumulative count of Article Views (full-text article views including HTML views, PDF and ePub downloads, according to the available data) and Abstracts Views on Vision4Press platform.
Data correspond to usage on the plateform after 2015. The current usage metrics is available 48-96 hours after online publication and is updated daily on week days.
Initial download of the metrics may take a while.