Fig. 2
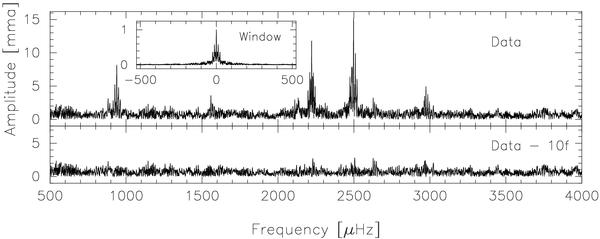
Amplitude spectrum of the 2005 light curve. The upper panel shows the amplitude spectrum in units of milli-modulation amplitude (mma) as a function of the frequency in μHz, in the frequency range 500–4000 μHz; no significant signal is detected outside this frequency range. The corresponding window function is shown on the same scale in the insert. The lower panel shows the residuals after subtraction of the 10 significant frequencies detected.
Current usage metrics show cumulative count of Article Views (full-text article views including HTML views, PDF and ePub downloads, according to the available data) and Abstracts Views on Vision4Press platform.
Data correspond to usage on the plateform after 2015. The current usage metrics is available 48-96 hours after online publication and is updated daily on week days.
Initial download of the metrics may take a while.