Fig. 13
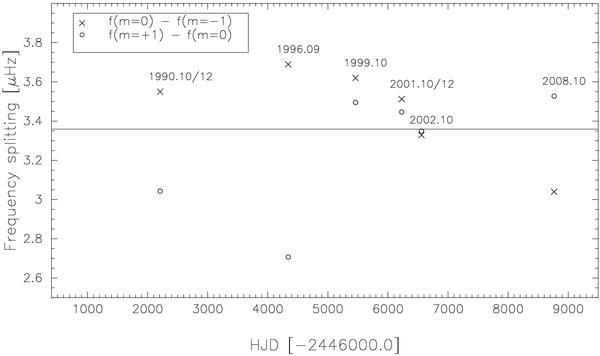
Time modulation of the frequency shifts of the retrograde (m = − 1) and prograde (m = + 1) components of the triplet centered at 2224 μHz. The frequency shift f(m = 0) – f(m = − 1) for the retrograde component ( × ) and f(m = + 1) – f(m = 0) for the prograde component (o) are plotted as function of time, relatively to their average value marked by the continuous horizontal line.
Current usage metrics show cumulative count of Article Views (full-text article views including HTML views, PDF and ePub downloads, according to the available data) and Abstracts Views on Vision4Press platform.
Data correspond to usage on the plateform after 2015. The current usage metrics is available 48-96 hours after online publication and is updated daily on week days.
Initial download of the metrics may take a while.