Fig. 1
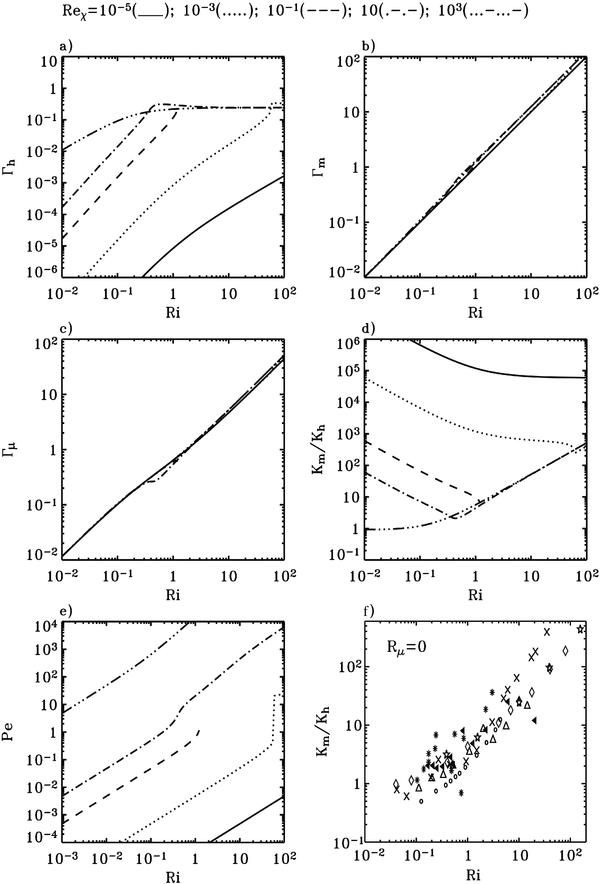
No doublediffusion, shear only. The heat, momentum, and μ mixing efficiencies, as defined in Eq. (1f), vs. Ri for different values of the combination RePr which in the figures is denoted by Reχ. In Fig. 1d we plot the turbulent Prandtl number σt defined in Eq. (14) vs. Ri for different Reχ. In Fig. 1e we plot the Peclet number vs. Ri. In Fig. 1f we plot the data corresponding to the case Pe ≫ 1, which well reproduced well by the present model, lower curve in panel 1e. The data are as follows: meteorological observations (Kondo et al. 1978, slanting black triangles; Bertin et al. 1997, snow flakes), lab experiments (Strang & Fernando 2001, black circles; Rehmann & Koseff 2004, slanting crosses; Ohya 2001, diamonds), LES (Zilitinkevich et al. 2007a,b, triangles), DNS (Stretch et al. 2001, five-pointed stars).
Current usage metrics show cumulative count of Article Views (full-text article views including HTML views, PDF and ePub downloads, according to the available data) and Abstracts Views on Vision4Press platform.
Data correspond to usage on the plateform after 2015. The current usage metrics is available 48-96 hours after online publication and is updated daily on week days.
Initial download of the metrics may take a while.