Fig. 2
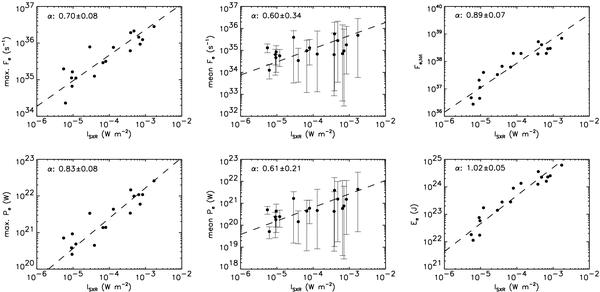
Nonthermal electron fluxes Fe (upper row) and kinetic powers Pe (lower row) as a function of maximum GOES soft X-ray flux ISXR (i.e., GOES class; here ISXR = 10-6 W m-2 is a C1 flare, while ISXR = 10-4 W m-2 represents an X1 flare) for the 18 flares analyzed. The left column shows the maximum values of Fe and Pe, the middle column the mean values (with the error bars showing the whole range from minimum to maximum), and the right column shows the total flux Fe, tot and kinetic energy Ee of the electrons in the different flares. Also shown are linear fits using the bisector method (dashed line) and the slope α.
Current usage metrics show cumulative count of Article Views (full-text article views including HTML views, PDF and ePub downloads, according to the available data) and Abstracts Views on Vision4Press platform.
Data correspond to usage on the plateform after 2015. The current usage metrics is available 48-96 hours after online publication and is updated daily on week days.
Initial download of the metrics may take a while.