Fig. 2
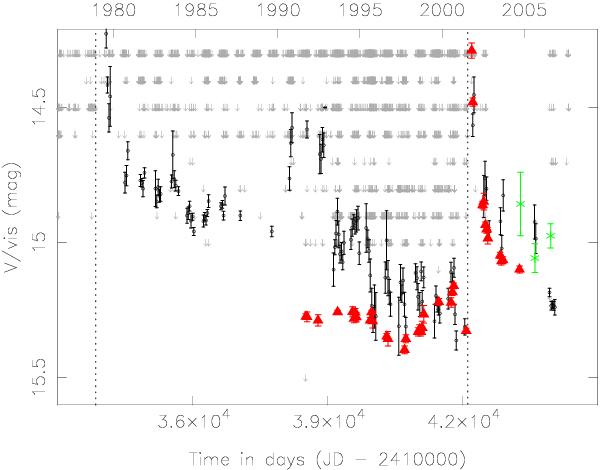
Monthly averages of all the visual (small open circles) and RoboScope V-band (red filled triangles) data displayed in Fig. 1 (bottom), as well as yearly averages (because of the few measurements available) for the AAVSO V-band data (green asterisks). Shown are the 1978–2001 quiescent and post-2001 superoutburst intervals. Only those points whose averages are based on more than 11 (arbitrary chosen number) measurements are shown. Errors shown are the 1σ uncertainties per interval. Upper limits are given by light-grey arrows. (Many upper limits after 2003 have not been validated yet, which explains the apparent gap in that time frame.) The times of the peak of the 1978 (near JD 2443845) and 2001 (near JD 2452115) superoutbursts are marked by dotted lines.
Current usage metrics show cumulative count of Article Views (full-text article views including HTML views, PDF and ePub downloads, according to the available data) and Abstracts Views on Vision4Press platform.
Data correspond to usage on the plateform after 2015. The current usage metrics is available 48-96 hours after online publication and is updated daily on week days.
Initial download of the metrics may take a while.