Fig. 1
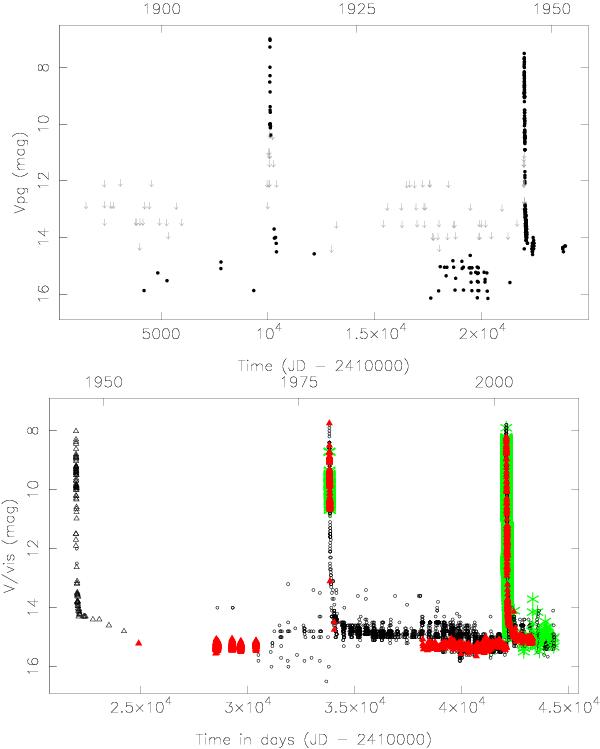
Top: all photographic plate measurements between 1890 and 1951 available in the literature. Upper limits are indicated with light grey arrows. Bottom: all visual (small open circles) and photometric V-band (green asterisks) detections available in the AAVSO database that passed the AAVSO validation tests. Also plotted are visual (open triangles) and V-band observations available in the literature, as well as the RoboScope V-band data (all red filled triangles).
Current usage metrics show cumulative count of Article Views (full-text article views including HTML views, PDF and ePub downloads, according to the available data) and Abstracts Views on Vision4Press platform.
Data correspond to usage on the plateform after 2015. The current usage metrics is available 48-96 hours after online publication and is updated daily on week days.
Initial download of the metrics may take a while.