Fig. 6
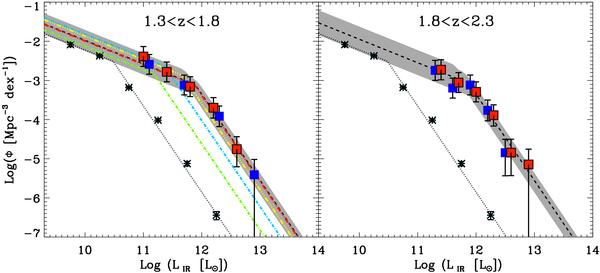
Infrared LF estimated in two redshift bins with the 1/Vmax method. Red and dark blue squares are obtained using  and
and  respectively (see text). Asterisks show the local reference taken from Sanders et al. (2003) and the dotted line represents the best-fit to these data points with a double power law function with fixed slopes (see text). The dashed line represents the best fit of the infrared LF assuming that the shape of the infrared LF remains the same since zs0. The dark shaded area span all the solutions obtained with the χ2 minimization method and compatible, within 1σ, with our data points. In the first redshift panel, we reproduce in green, blue, yellow and red the best fit of the LF obtained at 0.4 < z < 0.7, 0.7 < z < 1.0, 1.0 < z < 1.3 (Magnelli et al. 2009), and 1.8 < z < 2.3 respectively.
Current usage metrics show cumulative count of Article Views (full-text article views including HTML views, PDF and ePub downloads, according to the available data) and Abstracts Views on Vision4Press platform.
Data correspond to usage on the plateform after 2015. The current usage metrics is available 48-96 hours after online publication and is updated daily on week days.
Initial download of the metrics may take a while.