Fig. 5
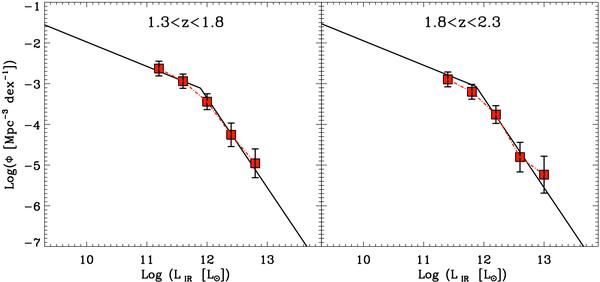
Results of our Monte Carlo simulations. Black lines represent the infrared LF that one would have inferred using an ideal sample with no redshift or bolometric correction uncertainties. Red squares show the mean infrared LF inferred using our 1000 mock catalogs. Error bars correspond to the dispersion observed in our 1000 Monte Carlo simulations.
Current usage metrics show cumulative count of Article Views (full-text article views including HTML views, PDF and ePub downloads, according to the available data) and Abstracts Views on Vision4Press platform.
Data correspond to usage on the plateform after 2015. The current usage metrics is available 48-96 hours after online publication and is updated daily on week days.
Initial download of the metrics may take a while.