Fig. 4
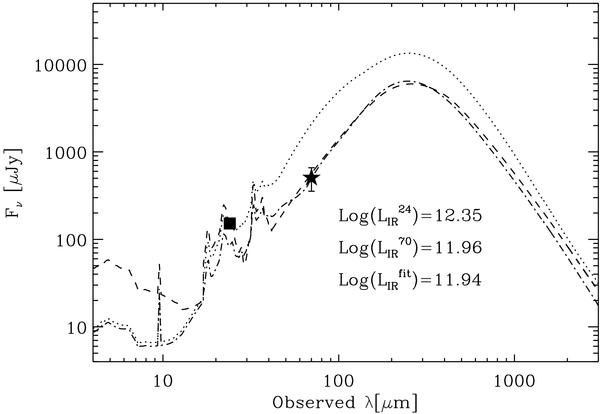
Different infrared bolometric corrections applied to a zs1.8 galaxy. Black square represents the observed 24 μm flux density while the black star represents the 70 μm flux density predicted using the L24 μm/(1 + z) − L70 μm/(1 + z) correlation. Dotted line and the dashed-dot line represent the unscaled CE01 templates corresponding respectively to the observed 24 μm and the predicted 70 μm flux densities. The dashed line represents the scaled CE01 template which best fit the 24 and 70 μm flux densities of this galaxy.  , and
, and  give the infrared luminosity derived by integrating the dotted line, the dashed-dot line and the dashed line respectively.
Current usage metrics show cumulative count of Article Views (full-text article views including HTML views, PDF and ePub downloads, according to the available data) and Abstracts Views on Vision4Press platform.
Data correspond to usage on the plateform after 2015. The current usage metrics is available 48-96 hours after online publication and is updated daily on week days.
Initial download of the metrics may take a while.