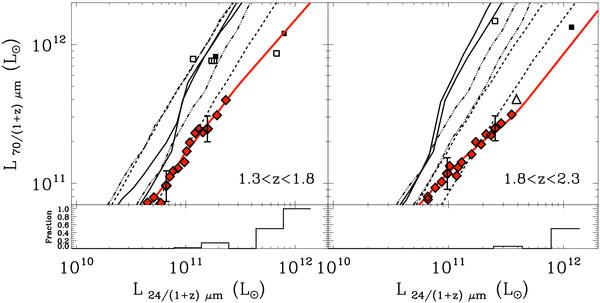
Fig. 3

The 70 vs. 24 μm correlations as revealed by the observations and our stacking analysis in the two redshift bins considered in this study. The empty and filled squares represent the 70 vs. 24 μm correlations observed for sources individually detected at 70 μm with photometric or spectroscopic redshift respectively. The red diamonds show the results obtained using our stacking analysis (see text). For clarity the error bars of our stacking analysis are shown only for two points. These error bars are computed using a standard bootstrap analysis and an estimate of background fluctuation using a stacking analysis at random positions (for more detail see Magnelli et al. 2009). The empty triangle shows the median correlation found in the sample of Murphy et al. (2009). The thin solid lines, the dashed lines and the triple-dots-dash lines represent the expected correlations for the CE01, the LDP and the DH libraries, respectively, at the lowest and the highest redshift of each redshift bin. The red solid line represents the inferred 24/70 μm correlation derived using a smooth linear interpolation between red diamonds and extended at high luminosities using 24 μm sources individually detected at 70 μm. At the bottom of each plot we present the fraction of 24 μm sources that are individually detected at 70 μm as a function of the 24/(1 + z) μm luminosity.
Current usage metrics show cumulative count of Article Views (full-text article views including HTML views, PDF and ePub downloads, according to the available data) and Abstracts Views on Vision4Press platform.
Data correspond to usage on the plateform after 2015. The current usage metrics is available 48-96 hours after online publication and is updated daily on week days.
Initial download of the metrics may take a while.


