Fig. 10
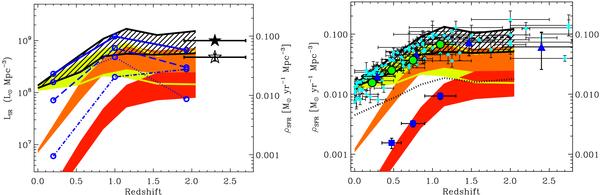
(Left) Evolution of the comoving IR energy density up to zs2.3. Blue empty circles represent the results obtained by Caputi et al. (2007) for the global evolution of the comoving energy density (solid line) and the relative contribution of “normal” galaxies (dot line), LIRGs (dashed line) and ULIRGs (dot dashed line). Filled black star represents the comoving IR energy density of the Universe inferred at zs2.3 by Reddy et al. (2008) while open star shows the relative contribution of LIRGs. Filled areas are as in Fig. 9. (Right) Evolution of the comoving SFR density up to zs2.3 assuming that SFR and LIR are related by Eq. (3) for a Salpeter IMF. Filled areas are as in Fig. 9. The dotted line represents the SFR measured using the UV light not corrected for dust extinction (Tresse et al. 2007). The dashed line represents the total SFR density defined as the sum of the SFR density estimated using our infrared observations and the SFR density obtained from the UV light uncorrected for dust extinction. Light blue diamonds are taken from Hopkins & Beacom (2006) and represent the SFR densities estimated using various estimators. Dark blue triangles represent the SFR density estimated by Seymour et al. (2008) using deep radio observations. Green circles represent the SFR density estimated by Smolčić et al. (2009) using deep 20 cm observations and dark blue squares represent the relative contribution of ULIRGs to this SFR density.
Current usage metrics show cumulative count of Article Views (full-text article views including HTML views, PDF and ePub downloads, according to the available data) and Abstracts Views on Vision4Press platform.
Data correspond to usage on the plateform after 2015. The current usage metrics is available 48-96 hours after online publication and is updated daily on week days.
Initial download of the metrics may take a while.