Fig. 1
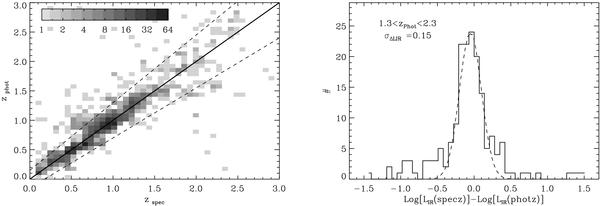
(Left) Comparison between the photometric and spectroscopic redshifts of our 24 μm-selected catalog. This comparison is made using 1670 galaxies which have both kinds of redshifts. Dashed lines represent the relative errors found in the redshift range of our study (i.e., σΔz/(1 + z) = 0.14 for 1.3 < z < 2.3). (Right) Uncertainty in determining LIR from 24 μm fluxes densities and the Chary & Elbaz (2001) library due to error in photometric redshift estimates (black histogram). The dashed line is a Gaussian fit to this uncertainty distribution with σ = 0.15. Note that the uncertainty distribution is not Gaussian.
Current usage metrics show cumulative count of Article Views (full-text article views including HTML views, PDF and ePub downloads, according to the available data) and Abstracts Views on Vision4Press platform.
Data correspond to usage on the plateform after 2015. The current usage metrics is available 48-96 hours after online publication and is updated daily on week days.
Initial download of the metrics may take a while.