Fig. 5
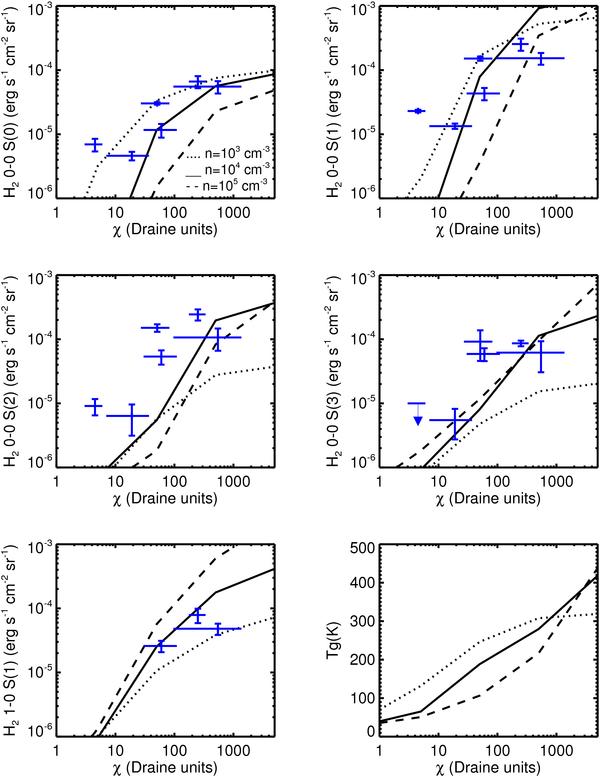
Intensites of several pure rotational lines 0–0 S(0) through S(3) as well as for the ro-vibrational line 1–0 S(1) predicted by the PDR model for different gas densities – n = 105 cm-3 (dashed lines), n = 104 cm-3 (solid lines), n = 103 cm-3 (dotted lines) – as a function of the strength of the FUV incident radiation field, χ. The kinetic temperature at the photodissociation front Tg obtained in the grid of models is also presented in the lower right panel. The blue points with error bars show the observed intensity for our PDR sample. From left to right, we have L1721 (χ = 4.5), California (χ = 19), N7023E (χ = 51), Horsehead (χ = 60), rho Oph (χ = 250), and N2023N (χ = 550). Horizontal error bars due to uncertainties in the FUV field are given. Vertical error bars for uncertainties in the intensities are also given. The arrows indicate the upper limits. For comparison of the predicted and observed line intensities, in the model the PDRs have been tilted with respect to the line of sight with cos(θ) = 0.15.
Current usage metrics show cumulative count of Article Views (full-text article views including HTML views, PDF and ePub downloads, according to the available data) and Abstracts Views on Vision4Press platform.
Data correspond to usage on the plateform after 2015. The current usage metrics is available 48-96 hours after online publication and is updated daily on week days.
Initial download of the metrics may take a while.