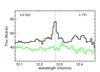
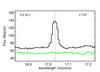
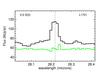
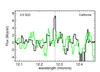
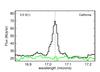
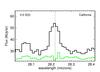
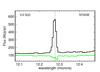
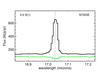
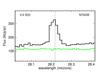
Fig. 2

Average IRS spectra obtained with the high spectral resolution mode for three objects of our sample (L1721, California, and N7023E). In each panel, the line spectrum is shown with the local rms noise (for clarity, an arbitrary offset value has been added to the noise). The black and green lines represent the line spectrum and the noise, respectively. With increasing wavelength, the panels show H2 pure rotational lines at 12.29, 17.03, and 28.2 μm.
Current usage metrics show cumulative count of Article Views (full-text article views including HTML views, PDF and ePub downloads, according to the available data) and Abstracts Views on Vision4Press platform.
Data correspond to usage on the plateform after 2015. The current usage metrics is available 48-96 hours after online publication and is updated daily on week days.
Initial download of the metrics may take a while.