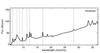
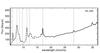
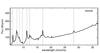
Fig. 1
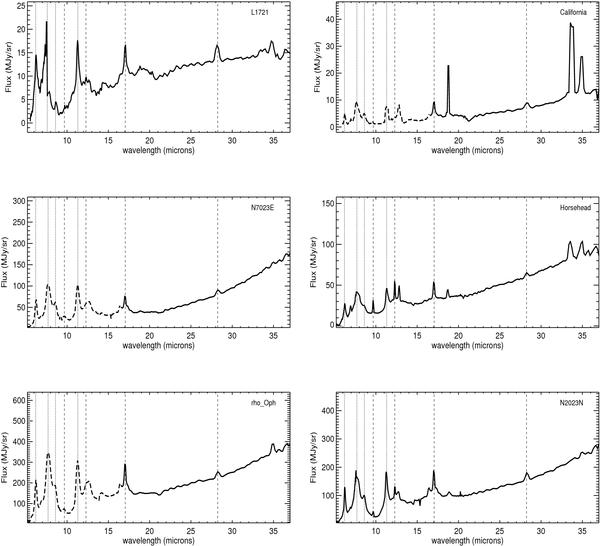
Average IRS spectra obtained with the low spectral resolution mode. The average areas used are marked in Fig. 3. For L1721 and California, all pixels are averaged in order to increase the signal-to-noise ratio, since these extended PDRs are fainter and do not present any detected spatial variation within the field observed with IRS. In the case of California, N7023E and rho Oph, only the LL IRS submodule data are available. These three objects have already been observed with the CVF of ISOCAM. We present here the combined ISO-CVF (dashed lines) and IRS-LL (solid lines) spectra. The IRS wavelength coverage allows us to detect several strong H2 pure rotational lines from 0–0 S(0)–S(3) at 28.2, 17.03, 12.29, and 9.66 μm, the aromatic band features at 6.2, 7.7, 8.6, 11.3 μm, the dust mid-IR continuum emission and the fine structure lines of ionized gas [NeII] at 12.8 μm, [SIII] at 18.7 and 33.4 μm and [SiII] at 34.9 μm. The dashed vertical lines delineate the H2 0–0 S(0)–S(3) lines position. The dotted vertical lines delineate the aromatic band feature position.
Current usage metrics show cumulative count of Article Views (full-text article views including HTML views, PDF and ePub downloads, according to the available data) and Abstracts Views on Vision4Press platform.
Data correspond to usage on the plateform after 2015. The current usage metrics is available 48-96 hours after online publication and is updated daily on week days.
Initial download of the metrics may take a while.