Fig. 2
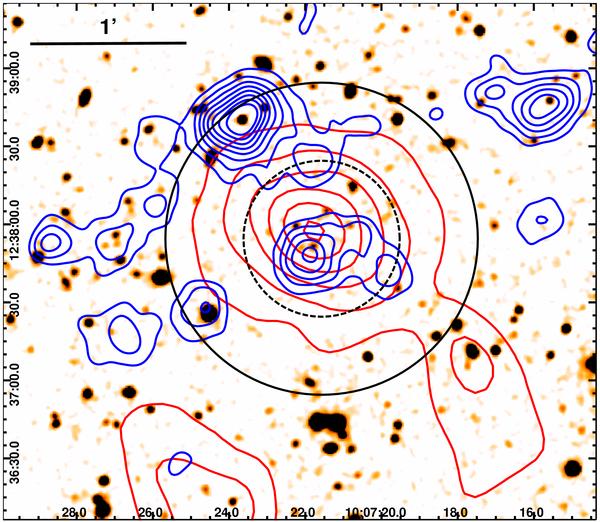
H-band view of the 3.8′ × 3.3′ cluster environment. Red contours indicate the log-spaced projected densities of very red galaxies with colors 3 ≤ z − H ≤ 4 (see Fig. 3) spanning the levels 2–16 arcmin-2, Chandra X-ray surface brightness contours (0.7–2 keV, log-spaced) are shown in blue in the range 0.014–0.082 counts arcsec-2. 30″ (dashed) and 60″ (solid) radii around the X-ray center are marked by circles.
Current usage metrics show cumulative count of Article Views (full-text article views including HTML views, PDF and ePub downloads, according to the available data) and Abstracts Views on Vision4Press platform.
Data correspond to usage on the plateform after 2015. The current usage metrics is available 48-96 hours after online publication and is updated daily on week days.
Initial download of the metrics may take a while.