| Issue |
A&A
Volume 527, March 2011
|
|
|---|---|---|
| Article Number | A133 | |
| Number of page(s) | 9 | |
| Section | Interstellar and circumstellar matter | |
| DOI | https://doi.org/10.1051/0004-6361/201016160 | |
| Published online | 10 February 2011 | |
Research Note
The outburst and nature of two young eruptive stars in the North America/Pelican Nebula Complex⋆
1
Leiden Observatory, Leiden University,
PO Box 9513,
2300 RA
Leiden,
The Netherlands
e-mail: This email address is being protected from spambots. You need JavaScript enabled to view it.
2
Konkoly Observatory of the Hungarian Academy of Sciences,
PO Box 67,
1525
Budapest,
Hungary
3
Instituto de Astrofísica de Canarias, 38200 La Laguna, Tenerife, Spain
4
Departamento de Astrofísica, Universidad de La
Laguna, 38205 La
Laguna, Tenerife,
Spain
5
Department of Astronomy, Loránd Eötvös University,
Pázmány P. st. 1/A,
Budapest
1117,
Hungary
6
Baja Astronomical Observatory of Bács-Kiskun County,
PO Box 766,
6500
Baja,
Hungary
Received: 17 November 2010
Accepted: 17 January 2011
Abstract
Context. The sudden optical brightening of two young stellar objects, HBC 722 and VSX J205126.1+440523, located in the North America/Pelican Nebula Complex, was announced in August 2010. Early photometric and spectroscopic observations of these objects indicated that they may belong to the FUor or EXor class of young eruptive stars. The eruptions of FUors and EXors are often explained by enhanced accretion of material from the circumstellar disk to the protostar.
Aims. In order to determine the true nature of these two objects, we started an optical and near-infrared monitoring program, and complemented our data with archival observations and data from the literature.
Methods. We plot and analyze pre-outburst and outburst spectral energy distributions (SEDs), multi-filter light curves, and color–color diagrams.
Results. The quiescent SED of HBC 722 is consistent with that of a slightly reddened normal T Tauri-type star. The source brightened monotonically in about two months, and the SED obtained during maximum brightness indicates the appearance of a hot, single-temperature blackbody. The current fading rate implies that the star will return to quiescence in about a year, which questions its classification as a bone fide FUor. The quiescent SED of VSX J205126.1+440523 looks like that of a highly embedded Class I source. The outburst of this source happened more gradually, but reached an unprecedentedly high amplitude. Its light curves showed a deep minimum two and a half months after the peak, when the object was close to its pre-outburst optical brightness. Further monitoring indicates that it is still far from being quiescent.
Conclusions. The shape of the light curves as well as the bolometric luminosities and accretion rates suggest that these objects do not fit into the classic FUor group. Although HBC 722 exhibits all spectral characteristics of a bona fide FUor, its luminosity and accretion rate is too low and its timescale is too fast compared with classical FUors. VSX J205126.1+440523 seems to be an example where quick extinction changes modulate the light curve.
Key words: stars: formation / infrared: stars / circumstellar matter
Figure 1 and Tables 1–3 are only available in electronic form at http://www.aanda.org
© ESO, 2011
1. Introduction
In August 2010, two new young eruptive star candidates were discovered in the North America/Pelican Nebula Complex (distance: 550 pc, Straizys et al. 1989). HBC 722 (also known as LkHα 188 G4 and PTF 10qpf) brightened by ΔR = 3.3 mag between 2010 May and August (Semkov & Peneva 2010). VSX J205126.1+440523 (also known as IRAS 20496+4354 and PTF 10nvg) brightened by 1.8 mag in unfiltered light between 2009 December and 2010 June, but Digitized Sky Survey plates show that it had been several magnitudes fainter in quiescence (Itagaki & Yamaoka 2010; Munari et al. 2010). Semkov et al. (2010) and Miller et al. (2011) provided light curves and spectroscopy for HBC 722 and concluded that we witness a bona fide outburst of a FUor-type object. FUors, named after the prototype object FU Orionis, brighten by up to 5 mag at optical wavelengths and may stay in the high state for decades. Covey et al. (2011) presented light curves and spectroscopy for VSX J205126.1+440523, and found that in many respects this object is different from FUors or EXors (the latter being another class of eruptive YSOs, named after the prototype EX Lup, which flares up by 1–5 mag every few years and stays bright for several months). Currently only about two dozens of young eruptive stars (FUors and EXors) are known, thus the two new outbursts announced in August 2010 are noteworthy events. Should they turn out to be accretion-powered eruptions, detailed study of these outbursts may contribute to the understanding of these important phases of early stellar evolution.
In this paper we present an optical and infrared view of the two eruptive star candidates. Using archival and new data, we characterize their circumstellar environment and compare them with those of some better studied FUors and EXors. We present new optical and near-infrared photometric data points taken during the outburst, which indicate that HBC 722 already passed its peak brightness and started a monotonous fading with a steady fading rate, while neither the brightening nor the fading of VSX J205126.1+440523 was monotonous.
2. Observations and data reduction
Optical observations.
(B)VRI-band images were obtained between 2010 September 19 and 2011 January 2 with three telescopes: the 60/90/180 cm (aperture diameter/primary mirror diameter/focal length) Schmidt telescope of the Konkoly Observatory (Hungary), the 1 m (primary mirror diameter) RCC telescope of the Konkoly Observatory, and the 80 cm (primary mirror diameter) IAC-80 telescope of the Teide Observatory in the Canary Islands (Spain). The Konkoly Schmidt telescope is equipped with a 4096 × 4096 pixel Apogee Alta U16 CCD camera (pixel scale: 1.03′′), and a Bessel BV(RI)C filter set. The 1 m RCC is equipped with a 1300 × 1340 pixel Roper Scientific WersArray: 1300B CCD camera (pixel scale: 0.306′′), and a Bessel UBV(RI)C filter set. The Teide IAC-80 telescope is equipped with a 2048 × 2048 pixel Spectral Instruments E2V 42–40 back-illuminated CCD camera “CAMELOT” (pixel scale: 0.304′′), and a Johnson-Bessel UBV(RI)J filter set. The images were reduced in IDL following the standard processing steps of bias subtraction and flat-fielding. On each night, for each target, images were obtained in blocks of three or five frames per filter. Aperture photometry for the target and other field stars were performed on each image using IDL’s cntrd and aper procedures. Because HBC 722 is surrounded by a reflection nebula, for consistency, we used the same apertures as Semkov et al. (2010): an aperture radius of 4′′ and a sky annulus between 13′′ and 19′′. For HBC 722, the instrumental magnitudes were transformed to the standard system using the eight brightest stars (from star “A” to star “H”) from the comparison sequence given in Semkov et al. (2010). For each image we fitted the difference of the instrumental and the standard magnitudes of the comparison stars as a function of the V − I color, and used this relationship to convert the instrumental magnitudes of our target to standard magnitudes. For VSX J205126.1+440523, we observed the standard field NGC 6823 with the Schmidt telescope during the photometric night 2010 September 23/24, and calibrated six comparison stars in the vicinity of our target. A finding chart and the standard magnitudes of the comparison stars are given in Fig. 1 and in Table 1 in the online material. The conversion of instrumental to standard magnitudes was made in the same way as for HBC 722. As for the comparison stars of HBC 722, we cannot exclude that the comparison stars of VSX J205126.1+440523 might be variables on longer timescales, although they were constant within the measurement uncertainties during our observing period. The resulting photometry for our two targets is presented in Tables 2 and 3 in the online material. We note that the R and I filters on the two telescopes are different, which may introduce a systematic difference in the magnitudes obtained with the different telescopes. However, in our experience, this difference is less than 0.05 mag (Kóspál et al. 2011). Because the observed brightness variations of our targets are much larger than 0.05 mag, this possible difference in the filter systems does not affect our analysis and conclusions.
Near-infrared observations.
JHKS images were obtained with the 1.52 m Telescopio Carlos Sanchez (TCS, Teide Observatory, Spain) between 2010 September 19 and November 19, using the 256 × 256 pixel Nicmos 3 detector CAIN-3 with the wide field optics (pixel scale: 1′′). Observations were performed in a 5-point dither pattern in order to enable proper sky subtraction. The images were reduced using a modified version of caindr, an iraf data reduction package written by Acosta-Pulido1. Data reduction steps included sky subtraction, flat-fielding, and the co-addition of all frames taken with the same filter. The sky image was obtained as the median combination of all frames, masking regions occupied by bright sources. The final image was produced using the standard “shift-and-add” technique, including rejection of outlier pixels. The instrumental magnitudes of the target and all good-quality 2MASS stars in the field were extracted using aperture photometry in IDL. For the photometric calibration we used the Two Micron All Sky Survey (2MASS) catalog (Cutri et al. 2003). We determined the offset between the instrumental and the 2MASS magnitudes by typically averaging 20–30 stars, using biweight_mean, an outlier-resistant averaging method. The resulting photometry of our two targets is presented in Tables 2 and 3 in the online material. We obtained additional near-infrared photometry using archival images from the UKIRT InfraRed Deep Sky Surveys (UKIDSS). These images were taken with the Wide Field Camera on the 3.8 m diameter UKIRT in 2006, and they are part of Data Release 8. Aperture photometry and calibration were executed in the same way as for the TCS data.
3. Results and analysis
3.1. HBC 722
HBC 722 is part of a small cluster of young stars called “LkHα 188 group” by Cohen & Kuhi (1979). In their naming convention, HBC 722 is called LkHα 188 G4. The whole cluster is located in a dark cloud that separates the North America and the Pelican Nebulae (Straizys et al. 1989). In outburst, the star is surrounded by a compact, asymmetric reflection nebula, which is well visible at optical wavelengths (Miller et al. 2011), but also discernible in our J band images.
Light curve.
The brightening of HBC 722 is well documented in Semkov et al. (2010) and Miller et al. (2011). Between August 2009 and July 2010, the star gradually brightened by 1 mag in the R band, then between July and August 2010, it brightened by another 3 mag, and reached a maximum brightness at the end of August 2010. We have been monitoring the star since September 2010. Our data confirm that the star reached is maximal brightness, and is currently gradually fading (Fig. 2). Between 2010 September 20 and December 3, HBC 722 decreased its brightness by 0.55, 0.54, 0.47, 0.37, 0.32, and 0.21 mag in the B,V,R,I,J,H, and KS bands, respectively, indicating that the source has become slightly redder. Fitting a line to the data points between these two epochs gives fading rates of 0.34, 0.25, 0.25, 0.21, 0.16, 0.13, and 0.07 mag/month in the B,V,R,I,J,H, and KS band, respectively. Our last optical data points taken on 2011 January 2 fit into this trend. Assuming that the linear fading continues with these rates, and taking into account the pre-outburst optical fluxes observed by Semkov et al. (2010) around July 2009, we estimate that the source will return to quiescence some time between fall 2011 and spring 2012. The two pre-outburst JHKS data sets (2MASS from June 2000 and UKIDSS from July 2006) agree within 0.1 mag, indicating a rather constant pre-outburst near-infrared brightness. Considering the relatively slow near-infrared fading rates, HBC 722 may exhibit higher than quiescent near-infrared fluxes even until fall 2013. Thus, current fading rates indicate that the outburst of HBC 722 would last approximately two or three years.
To put the outburst history of HBC 722 into context, we compare in Fig. 3 its light curve with those of other young eruptive objects. The recent extreme outburst of EX Lup exhibited a faster onset, more peaked maximum, and a fading which was initially very similar to that of HBC 722. However, EX Lup showed two deep minima before it went back to quiescence some eight months after its peak brightness. The light curve of V1057 Cyg, the FUor with the fastest known outburst and fading, is still much slower than that of HBC 722. The light curve of V1647 Ori, a source often classified as an intermediate-type between FUors and EXors, initially displayed a relatively slow fading, then suddenly went back to quiescence, and had an approximately 2.5-year-long outburst. If HBC 722 continues the linear fading it currently displays, the predicted outburst length will be remarkably similar to that of V1647 Ori. This comparison implies that HBC 722 is different from the classical FUors and is more similar to EXors, or intermediate objects between FUors and EXors.
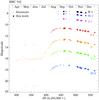 |
Fig. 2 Light curves of HBC 722. For better visibility, the B,V,I,J,H, and KS light curves were shifted along the y axis by the values indicated in the figure. Filled dots are from this work, plus signs are from Semkov et al. (2010) and Miller et al. (2011). |
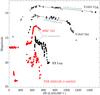 |
Fig. 3 Light curves of our targets and those of different young eruptive stars. Triangles: photographic light curve of V1057 Cyg from Gieseking (1973); stars: IC light curve of V1647 Ori from Acosta-Pulido et al. (2007); squares: visual light curve of EX Lup during its extreme outburst in 2008 (Ábrahám et al. 2009). For HBC 722 and VSX J205126.1+440523 we plotted the R-band light curves. The data for V1057 Cyg, V1647 Ori, and EX Lup were shifted along the y axis for better visibility and also along the x axis so that the peak brightness is approximately at the same position for all stars. |
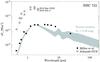 |
Fig. 4 Spectral energy distribution of HBC 722. Filled dots are pre-outburst data from Miller et al. (2011), while open circles are outburst data (this work). The gray shaded area indicates the median SED of T Tauri stars in the Taurus star-forming region with spectral types between K5 and M2 (data below 1.25 μm and above 40 μm are from D’Alessio et al. 1999, data between 1.25 and 40 μm are from Furlan et al. 2006). |
Spectral energy distribution.
Figure 4 shows the pre-outburst and outburst SEDs of HBC 722. Pre-outburst data are from Miller et al. (2011) and references therein, while the outburst data are from this work. In this figure we also overplotted with gray shading the typical SED of a T Tauri-type star in the Taurus star-forming region (D’Alessio et al. 1999; Furlan et al. 2006), scaled to the H-band data point, and reddened by AV = 3.36 mag (Cohen & Kuhi 1979). The outburst photometry indicates that a hot continuum is added to the quiescent SED. The B,V,R,I,J,H, and KS points indicate a blackbody-like spectrum at all epochs during the outburst. We could fit these points with a single temperature blackbody and obtained a temperature of 4000 K (using AV = 3.36 mag). With the assumption that the SED is similar to the Taurus median above 24 μm, we calculated a pre-outburst bolometric luminosity of 0.85 L⊙ by integrating the de-reddened SED between 0.44 and 200 μm. The outburst bolometric luminosity can be similarly calculated, but owing to the lack of mid-infrared data points, we can either assume a blackbody shape until 10 μm and assume that the SED did not change above 10 μm, or assume that the SED changed self-similarly in the whole 2 − 200 μm range. The former approach gives Lbol = 8.7 L⊙, the latter, Lbol = 12 L⊙. The true outburst luminosity is probably between these two values.
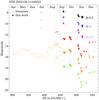 |
Fig. 5 Light curves of VSX J205126.1+440523. Filled dots are from this work, plus signs are from Covey et al. (2011) and from Seiichiro Kiyota and Hiroyuki Maehara (vsnet, http://tech.dir.groups.yahoo.com/group/vsnet-recent-fuori/messages), crosses are visual estimates by Itagaki & Yamaoka (2010). |
3.2. VSX J205126.1+440523
VSX J205126.1+440523 is situated in an isolated molecular cloud located about 15′ southeast of the Pelican Nebula molecular cloud (Bally & Reipurth 2003). The eastern rim of this small cloud is well visible in the [SII] and Hα images of Bally & Reipurth (2003). This morphology suggests that VSX J205126.1+440523 sits on the tip of a column of dense material, out of which it had been born. Apart from the Hα emission from the rim, no extended emission seems to be associated with the source, not even in outburst. Bally & Reipurth (2003) discovered several Herbig-Haro objects in this area, and claim that one of them, HH 569, is possibly driven by VSX J205126.1+440523.
Light curve.
In Fig. 5 we plot the light curves of VSX J205126.1+440523. Covey et al. (2011) reported the source to be between R = 18–19.25 mag in mid-2009. After that, it brightened by ≈ 6 mag, reaching its maximal brightness in August 2010. Since then, the source started fading, and by November 2010 nearly reached its mid-2009 optical brightness, then it brightened again. The light curves show that neither the brightening, nor the fading was monotonous. Although the near-infrared light curves are not as well-sampled as the optical ones, they delineate similar trends, but with smaller amplitudes. We note that the R = 19.25 mag reported by Covey et al. (2011) may not be the true quiescent brightness of the source, because the source was ≈20 mag in the POSS2 red plate taken in 1990 (Itagaki & Yamaoka 2010). The comparison of the UKIDSS and TCS photometry indicates that the source brightened by ΔJ = 7.9 mag, ΔH = 6.7 mag, and ΔKS = 4.8 mag between July 2006 and September 2010. We note that the source was KS = 13.15 mag in 2006, but it was not visible in the KS band in the 2MASS images taken in October 2000. Since the 2MASS PSC is complete down to KS = 14.3 mag (Cutri et al. 2003), the source must have brightened at least 1.15 mag between 2000 and 2006, making the true KS-band magnitude change at least 5.8 mag.
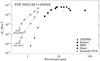 |
Fig. 6 Spectral energy distribution of VSX J205126.1+440523. Filled dots are pre-outburst data from various dates, while open circles are outburst data (see text). |
The comparison of the light curve of VSX J205126.1+ 440523 with other young eruptive stars in Fig. 3 indicates that this source is different from all the other sources plotted, although the brightening and fading rates are most similar to those of EX Lup. Especially remarkable is the deep minimum of VSX J205126.1+440523 in November 2010, which is similar to the minima displayed by EX Lup shortly before the end of the eruption.
Spectral energy distribution.
In Fig. 6 we compiled a pre-outburst SED using data from the UKIDSS database (this work), the MSX6C Infrared Point Source Catalog (Egan et al. 2003), the AKARI/IRC mid-infrared all-sky survey (Ishihara et al. 2010), and Spitzer data (Covey et al. 2011, and references therein). Out of these data points, the UKIDSS and the Spitzer are quasi-simultaneous (all obtained between June and August 2006), while the MSX data are from 1996-1997, and the AKARI from 2006–2007. This SED should be analyzed with caution, considering the KS-band variability mentioned above. The outburst SED contains the optical and near-infrared photometry we obtained on 2010 September 20/23 and 2010 November 16/17. We note that by September, the source was already ≈ 2 mag fainter in R-band than at maximal brightness some 20 days earlier. The shape of the SED and that the source in quiescence was practically invisible (the only pre-outburst image where the source is visible at optical wavelengths is a POSS2 red plate, Itagaki & Yamaoka 2010) suggest that the source is highly extincted. However, dereddening its colors does not make it fall onto the T Tauri locus (Fig. 7). Correcting for a reddening of AV = 17...20 mag would result in a J − H color typical for T Tauri stars, but its H − KS color would still be too red. The reason for the strange near-infrared colors of VSX J205126.1+440523 may be partly interstellar reddening caused by the small cloud in which the source is embedded, partly circumstellar reddening by an envelope or thick disk. The relative importance of these two effects is not known, thus we do not attempt to correct for interstellar reddening, and calculate a bolometric luminosity of 14.7 L⊙ by simply integrating the quiescent SED from 1.25 to 200 μm. We calculate an outburst luminosity of 22 L⊙ similarly, assuming that the SED did not change above 10 μm, and using the September 2010 data points in Fig. 6.
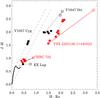 |
Fig. 7 Near-infrared color–color diagram. The main-sequence is marked by a thick solid line, the giant branch with dotted line (Koornneef 1983), the reddening path with dashed lines (Cardelli et al. 1989), and the T Tauri locus with dash-dotted line (Meyer et al. 1997). Open symbols: quiescent colors; filled symbols: outburst colors. Source of data: Kenyon et al. (1991) for V1057 Cyg, Acosta-Pulido et al. (2007) for V1647 Ori, 2MASS PSC and Juhász et al. (2011) for EX Lup, and this work for HBC 722 and VSXJ 205126.1+440523. |
4. Discussion
4.1. The nature of the sources in quiescence
The SED of HBC 722 seems to be consistent with that of a slightly reddened T Tauri star, both regarding the optical–near-infrared part of the SED and the 24 μm photometric point. This conclusion is in accordance with the claim of Miller et al. (2011) that HBC 722 is a Class II object where the central star is a K7-type star. It is remarkable, however, that between 3.6 and 8 μm there is an excess emission in the SED compared with the Taurus median. In this respect, the source somewhat resembles DR Tau, a highly accreting T Tauri star, which suggests that HBC 722 may be a highly accreting T Tauri star even in quiescence. That the quiescent optical spectrum taken by Cohen & Kuhi (1979) exhibits an unusually prominent Hα emission with an equivalent width of 100 Å supports this idea.
VSXJ 205126.1+440523 seems to be a much more reddened source. Its quiescent bolometric luminosity (≈15 L⊙) is significantly higher than that of HBC 722, indicating a somewhat larger mass. The quiescent SED in Fig. 6 probably represents a moderately reddened Class I source. The findings of Covey et al. (2011), who determined 6 mag < AV < 12.4 mag from the ratio of H emission lines observed in the outburst spectrum, supports this idea. This scenario requires a dense envelope in the system, but the lack of a reflection nebula around this source suggests the lack of an extended envelope. However, high interstellar extinction may render the scattered light invisible. The presence of a related Herbig-Haro object also advocates the Class I scenario.
4.2. The outburst mechanism
The comparison of the quiescent and the outburst SEDs (Fig. 4) suggests that the brightening of HBC 722 can be interpreted as the appearance of a hot continuum. The data points can be fitted with a temperature of ≈ 4000 K, somewhat less than what one would expect from an accretion outburst, where ionized material is present. Note however that the temperature may be higher if the extinction toward the system is higher. It is noteworthy that the outburst excess can be described in the optical–near-infrared regime by a single temperature blackbody rather than a disk-like emission reflecting a radial (usually outwards decreasing) temperature profile. The fading of HBC 722 is mostly color-independent in the near-infrared regime (Fig. 7), while optical colors are becoming slightly redder. This may indicate that the hot continuum is both fading and cooling.
The reason for the brightening of VSX J205126.1+440523 is more enigmatic. In this case the excess emission in outburst is not a single-temperature radiation, but seems to have a temperature distribution at all epochs (Fig. 5). The amplitude of the outburst in the J,H and KS bands is larger than any brightening observed so far for YSOs. At first glance, one may think that the brightening was caused by suddenly decreased extinction. However, in this case the source should have moved along the reddening path in the J − H vs. H − KS diagram (Fig. 7), which was not the case during the rising part of the lightcurve. JHKS photometry obtained after maximum brightness indicates that the fading of VSX J205126.1+440523 initially happened along the same path as the brightening, suggesting that whatever was the cause of the flux changes, it was a reversible process. Changing accretion is an appealing idea because it would explain the presence of the Herbig-Haro object that was possibly ejected from the source during a previous outburst (enhanced accretion is often accompanied by enhanced mass outflow). It also suggests that the outburst activity of VSXJ 205126.1+440523 may be repetitive. However, photometry obtained in November 2010 indicates a deep minimum in Fig. 5. At the same time, the source moved along the reddening path in Fig. 7. Both the color changes and the brightness changes in the J,H, and KS bands are consistent with an extinction increase of AV = 9 mag. Thus, it may be possible that the deep minimum in November 2010 was caused by a dust condensation effect (similar to what happened to V1515 Cyg in 1980 (Kenyon et al. 1991), or an eclipse by dust clumps in an almost edge-on disk system (similarly to what causes deep optical minima of the UX Orionis-type stars, see e.g. Eaton & Herbst 1995).
4.3. Classification as a FUor outburst
When discovered, both sources were announced as FUor candidates. Extensive analyses presented in Semkov et al. (2010) and Miller et al. (2011) indicated that HBC 722 can be considered as a bona fide FUor. On the other hand, Covey et al. (2011) concluded that VSX J205126.1+440523 does not appear to belong to either the FUor or the EXor class. FUors are usually bright objects in outburst with luminosities of a few hundred L⊙ (Hartmann & Kenyon 1996). The immense radiation is related to the increased accretion rate, which can reach values of up to 10-4 M⊙/yr. However, the outburst luminosities of our objects are only on the order of 10–20 L⊙. Assuming that the luminosity excess in eruption is completely caused by the release of accretion energy, the computed accretion rate for HBC 722 (assuming a stellar mass of 0.5 M⊙ and a radius of 3 R⊙) is 10-6 M⊙/yr. Covey et al. (2011) determined an accretion rate of 2.5 × 10⁻⁷ M⊙/yr for VSX J205126.1+440523. Both these values are well below the typical value for classical FUors.
The brightening and fading rates for both of our sources are also too fast compared with classical FUor light curves. We made a comparison for HBC 722 with several young eruptive stars and found a mismatch with the prototype FUor V1057 Cyg, but more similarities with the light curves of EX Lup, the prototype of EXors, and V1647 Ori, an object often classified as an intermediate object between FUors and EXors. The slow brightening of VSX J205126.1+440523 is not unheard of (both FU Ori and V1057 Cyg had a rise-time of about one year, for other sources the estimates range between 3 and 20 years, Bell & Lin 1994), but the fading is far too rapid. According to our light curve (Fig. 5), 2.5 months after peak brightness VSX J205126.1+440523 dimmed by about 5 mag in V-band. This is closer to the typical timescales of EXor flare-ups than that of bona fide FUor outbursts (decades to centuries). The non-monotonous fading of this source also resembles the light curve of the recent outburst of EX Lup (Fig. 3). The moderate resolution near-infrared spectrum obtained in outburst by Covey et al. (2011) also shows similarities to that of EX Lup (Kóspál et al., in prep.).
It is remarkable that HBC 722 possesses all spectral characteristics of bona fide FUors but its luminosity is an order of magnitude lower, and its fading timescale is much faster. This suggests that the physical mechanism behind the FUor-type eruptions should also work with lower accretion rates, although probably producing shorter outbursts. This conclusion questions the thermal instability model of Bell & Lin (1994), who suggested the existence of a threshold mass accretion rate from the outer to the inner circumstellar disk. Matter can pile up at the inner edge of the disk and fall onto the stellar surface following a sudden thermal instability only if the quiescent accretion rate is higher than this threshold value. Thus, it seems that in the regime of low-luminosity outbursts (≈10 L⊙), both FUor-like eruptions (when the source exhibits all spectral characteristics of FUors like HBC 722) and EXor-like events (when the source exhibits a typical T Tauri spectrum with emission lines and CO bandhead
emission, somewhat similar to VSX J205126.1+440523) can occur. If both HBC 722 and VSX J205126.1+440523 are indeed young eruptive stars, one might conclude that the class of young eruptive stars is even more diverse than previously thought.
Online material
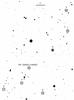 |
Fig. 1 Finding chart for VSX J205126.1+440523 and its comparison stars. North is up and east is to the left. |
V(RI)C photometry for the comparison stars used for VSX J205126.1+440523. Typical uncertainties are 0.04 mag.
Photometry for VSX J205126.1+440523.
Photometry for HBC 722.
for more details on the caindr package, see http://www.iac.es/telescopes/cain/cain_eng.html
Acknowledgments
This work is based in part on observations made with the Telescopio Carlos Sanchez operated on the island of Tenerife by the Instituto de Astrofísica de Canarias in the Observatorio del Teide. The authors wish to thank the telescope manager A. Oscoz, support astronomer P. Montañes, and telescope operators R. Martí and M. Díaz for their help during the observations. This work is based in part on observations made with the Spitzer Space Telescope, which is operated by the Jet Propulsion Laboratory, California Institute of Technology under a contract with NASA. This work is based in part on data obtained as part of the UKIRT Infrared Deep Sky Survey. This publication makes use of data products from the Two Micron All Sky Survey, which is a joint project of the University of Massachusetts and the Infrared Processing and Analysis Center/California Institute of Technology, funded by the NASA and the National Science Foundation. The research of Á.K. is supported by the Nederlands Organization for Scientific Research.
References
- Ábrahám, P., Juhász, A., Dullemond, C. P., et al. 2009, Nature, 459, 224 [NASA ADS] [CrossRef] [PubMed] [Google Scholar]
- Acosta-Pulido, J. A., Kun, M., Ábrahám, P., et al. 2007, AJ, 133, 2020 [NASA ADS] [CrossRef] [Google Scholar]
- Bally, J., & Reipurth, B. 2003, AJ, 126, 893 [NASA ADS] [CrossRef] [Google Scholar]
- Bell, K. R., & Lin, D. N. C. 1994, ApJ, 427, 987 [NASA ADS] [CrossRef] [Google Scholar]
- Cardelli, J. A., Clayton, G. C., & Mathis, J. S. 1989, ApJ, 345, 245 [NASA ADS] [CrossRef] [Google Scholar]
- Cohen, M., & Kuhi, L. V. 1979, ApJS, 41, 743 [NASA ADS] [CrossRef] [Google Scholar]
- Covey, K. R., Hillenbrand, L. A., Miller, A. A., et al. 2011, AJ, 141, 40 [NASA ADS] [CrossRef] [Google Scholar]
- Cutri, R. M., Skrutskie, M. F., van Dyk, S., et al. 2003, 2MASS All Sky Catalog of point sources. [Google Scholar]
- D’Alessio, P., Calvet, N., Hartmann, L., Lizano, S., & Cantó, J. 1999, ApJ, 527, 893 [NASA ADS] [CrossRef] [Google Scholar]
- Eaton, N. L., & Herbst, W. 1995, AJ, 110, 2369 [NASA ADS] [CrossRef] [Google Scholar]
- Egan, M. P., Price, S. D., Kraemer, K. E., et al. 2003, VizieR Online Data Catalog, 5114, [Google Scholar]
- Furlan, E., Hartmann, L., Calvet, N., et al. 2006, ApJS, 165, 568 [NASA ADS] [CrossRef] [MathSciNet] [Google Scholar]
- Gieseking, F. 1973, Information Bulletin on Variable Stars, 806, 1 [NASA ADS] [Google Scholar]
- Hartmann, L., & Kenyon, S. J. 1996, ARA&A, 34, 207 [NASA ADS] [CrossRef] [EDP Sciences] [MathSciNet] [Google Scholar]
- Ishihara, D., Onaka, T., Kataza, H., et al. 2010, A&A, 514, A1 [NASA ADS] [CrossRef] [EDP Sciences] [Google Scholar]
- Itagaki, K., & Yamaoka, H. 2010, Central Bureau Electronic Telegrams, 2426, 1 [NASA ADS] [Google Scholar]
- Juhász, A., Dullemond, C. P., van Boekel, R., et al. 2011, ApJ, submitted [Google Scholar]
- Kenyon, S. J., Hartmann, L. W., & Kolotilov, E. A. 1991, PASP, 103, 1069 [NASA ADS] [CrossRef] [Google Scholar]
- Koornneef, J. 1983, A&A, 128, 84 [NASA ADS] [Google Scholar]
- Kóspál, Á., Salter, D. M., Hogerheijde, M. R., Moór, A., & Blake, G. A. 2011, A&A, 527, A96 [NASA ADS] [CrossRef] [EDP Sciences] [Google Scholar]
- Meyer, M. R., Calvet, N., & Hillenbrand, L. A. 1997, AJ, 114, 288 [NASA ADS] [CrossRef] [Google Scholar]
- Miller, A. A., Hillenbrand, L. A., Covey, K. R., et al. 2011, ApJ, accepted [Google Scholar]
- Munari, U., Valisa, P., Dallaporta, S., & Itagaki, K. 2010, Central Bureau Electronic Telegrams, 2428, 1 [NASA ADS] [Google Scholar]
- Semkov, E., & Peneva, S. 2010, The Astronomer’s Telegram, 2801, 1 [Google Scholar]
- Semkov, E. H., Peneva, S. P., Munari, U., Milani, A., & Valisa, P. 2010, A&A, 523, L3 [NASA ADS] [CrossRef] [EDP Sciences] [Google Scholar]
- Straizys, V., Meistas, E., Vansevicius, V., & Goldberg, E. P. 1989, A&A, 222, 82 [NASA ADS] [Google Scholar]
All Tables
V(RI)C photometry for the comparison stars used for VSX J205126.1+440523. Typical uncertainties are 0.04 mag.
All Figures
|
Fig. 2 Light curves of HBC 722. For better visibility, the B,V,I,J,H, and KS light curves were shifted along the y axis by the values indicated in the figure. Filled dots are from this work, plus signs are from Semkov et al. (2010) and Miller et al. (2011). |
| In the text | |
|
Fig. 3 Light curves of our targets and those of different young eruptive stars. Triangles: photographic light curve of V1057 Cyg from Gieseking (1973); stars: IC light curve of V1647 Ori from Acosta-Pulido et al. (2007); squares: visual light curve of EX Lup during its extreme outburst in 2008 (Ábrahám et al. 2009). For HBC 722 and VSX J205126.1+440523 we plotted the R-band light curves. The data for V1057 Cyg, V1647 Ori, and EX Lup were shifted along the y axis for better visibility and also along the x axis so that the peak brightness is approximately at the same position for all stars. |
| In the text | |
|
Fig. 4 Spectral energy distribution of HBC 722. Filled dots are pre-outburst data from Miller et al. (2011), while open circles are outburst data (this work). The gray shaded area indicates the median SED of T Tauri stars in the Taurus star-forming region with spectral types between K5 and M2 (data below 1.25 μm and above 40 μm are from D’Alessio et al. 1999, data between 1.25 and 40 μm are from Furlan et al. 2006). |
| In the text | |
|
Fig. 5 Light curves of VSX J205126.1+440523. Filled dots are from this work, plus signs are from Covey et al. (2011) and from Seiichiro Kiyota and Hiroyuki Maehara (vsnet, http://tech.dir.groups.yahoo.com/group/vsnet-recent-fuori/messages), crosses are visual estimates by Itagaki & Yamaoka (2010). |
| In the text | |
|
Fig. 6 Spectral energy distribution of VSX J205126.1+440523. Filled dots are pre-outburst data from various dates, while open circles are outburst data (see text). |
| In the text | |
|
Fig. 7 Near-infrared color–color diagram. The main-sequence is marked by a thick solid line, the giant branch with dotted line (Koornneef 1983), the reddening path with dashed lines (Cardelli et al. 1989), and the T Tauri locus with dash-dotted line (Meyer et al. 1997). Open symbols: quiescent colors; filled symbols: outburst colors. Source of data: Kenyon et al. (1991) for V1057 Cyg, Acosta-Pulido et al. (2007) for V1647 Ori, 2MASS PSC and Juhász et al. (2011) for EX Lup, and this work for HBC 722 and VSXJ 205126.1+440523. |
| In the text | |
|
Fig. 1 Finding chart for VSX J205126.1+440523 and its comparison stars. North is up and east is to the left. |
| In the text | |
Current usage metrics show cumulative count of Article Views (full-text article views including HTML views, PDF and ePub downloads, according to the available data) and Abstracts Views on Vision4Press platform.
Data correspond to usage on the plateform after 2015. The current usage metrics is available 48-96 hours after online publication and is updated daily on week days.
Initial download of the metrics may take a while.