Fig. 7
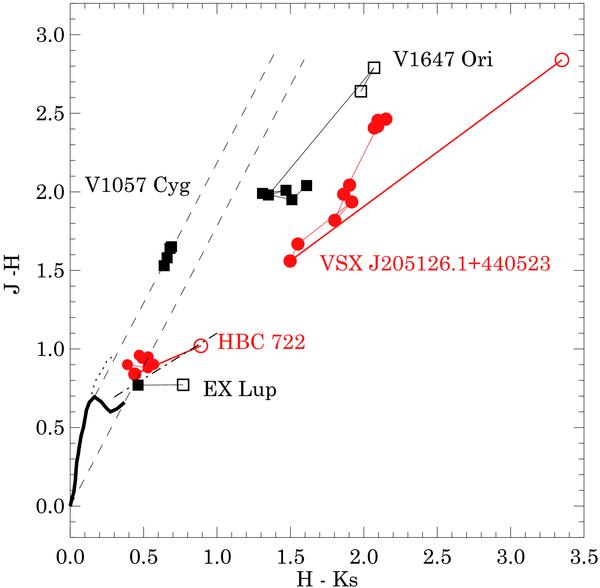
Near-infrared color–color diagram. The main-sequence is marked by a thick solid line, the giant branch with dotted line (Koornneef 1983), the reddening path with dashed lines (Cardelli et al. 1989), and the T Tauri locus with dash-dotted line (Meyer et al. 1997). Open symbols: quiescent colors; filled symbols: outburst colors. Source of data: Kenyon et al. (1991) for V1057 Cyg, Acosta-Pulido et al. (2007) for V1647 Ori, 2MASS PSC and Juhász et al. (2011) for EX Lup, and this work for HBC 722 and VSXJ 205126.1+440523.
Current usage metrics show cumulative count of Article Views (full-text article views including HTML views, PDF and ePub downloads, according to the available data) and Abstracts Views on Vision4Press platform.
Data correspond to usage on the plateform after 2015. The current usage metrics is available 48-96 hours after online publication and is updated daily on week days.
Initial download of the metrics may take a while.