| Issue |
A&A
Volume 527, March 2011
|
|
|---|---|---|
| Article Number | A146 | |
| Number of page(s) | 9 | |
| Section | Stellar atmospheres | |
| DOI | https://doi.org/10.1051/0004-6361/201016048 | |
| Published online | 14 February 2011 | |
CoRoT light curves of Blazhko RR Lyrae stars
Evidence of a strong correlation between phase and amplitude modulations of CoRoT ID 0105288363 ⋆,⋆⋆
1
Université Nice Sophia-Antipolis, Observatoire de la Côte d’Azur, UMR
6525,
Parc Valrose,
06108
Nice Cedex 02,
France
e-mail: This email address is being protected from spambots. You need JavaScript enabled to view it.
2 Antarctica Reaserch Station, South Pole, TAAF, Antarctica
3
INAF, Rome Astronomical Observatory, via Frascati 33, 00040
Monte Porzio Catone,
Italy
4
Dipartimento di Fisica, Universita’ di Roma Tor Vergata via Della
Ricerca Scientifica 1, 00133
Roma,
Italy
5
LESIA, Université Pierre et Marie Curie, Université Denis Diderot,
Observatoire de Paris, 92195
Meudon Cedex,
France
6
Institute of Astronomy, University of Vienna,
Türkenschanzstrasse
17, 1180
Vienna,
Austria
7
Instituut Voor Sterrenkunde, Catholic University of Leuven,
Celestijnenlaan
200D, 3001
Leuven,
Belgium
Received: 2 November 2010
Accepted: 24 November 2010
Abstract
Context. The CoRoT – Convection Rotation and planetary Transits – space mission provides a unique opportunity to monitor RR Lyrae stars with excellent time-sampling, unprecedented photometric precision, and a long time base of 150 days.
Aims. The pulsation characteristics of RR Lyrae stars rely on robust physics, but we still lack a firm quantitative understanding of the physical mechanisms driving the Blazhko modulation and the long-term changes in their pulsation behavior. We use the high-precision space data of an unknown RR Lyrae star CoRoT ID 0105288363 observed during a second long run centered on the Galaxy – LRc02 –, to improve our understanding of the pulsation properties of RR Lyrae stars.
Methods. The CoRoT data were corrected using a jump and trend filtering code. We applied different period-finding techniques including Period04, MuFrAn, PDM, and SigSpec. Amplitude and phase modulation were investigated using an analytical function method as well as traditional O−C diagrams.
Results. For the first time, we detect significant cycle-to-cycle changes in the Blazhko modulation, which appear to be analogous to those predicted by Stothers – owing to the suppression of turbulent convection – to explain this phenomenon. We discuss the clear correlations between the phase and the amplitude of the bump, and the skewness and acuteness of the light curve during different Blazhko cycles. We find that these quantities are strongly anticorrelated with the fundamental pulsation period. This provides a strong support to the slow convective cycle model suggested by Stothers.
We also detect a long-term modulation period in the maximum brightness spectrum. A more extended coverage of the long-term modulation is required to constrain its period. Seventh-order side peaks of the pulsation multiplet structure are also visible with the left-side peak amplitudes being higher than those of the right. This has never previously been detected.
Future theoretical investigations are required to understand on a quantitative basis the complex behavior of the Blazhko effect. In particular, we still lack firm constraints of the physical mechanisms driving both phase and amplitude modulations during consecutive Blazhko cycles and their correlation, if any, with the long-term modulation.
Key words: hydrodynamics / techniques: photometric / stars: individual: CoRoT ID 0105288363 / stars: oscillations / stars: variables: RR Lyrae / shock waves
The CoRoT space mission was developed and is operated by the French space agency CNES, with participation of ESA’s RSSD and Science Programmes, Austria, Belgium, Brazil, Germany, and Spain.
Tables 2 and 3 are only available in electronic form at the CDS via anonymous ftp to cdsarc.u-strasbg.fr (130.79.128.5) or via http://cdsarc.u-strasbg.fr/viz-bin/qcat?J/A+A/527/A146
© ESO, 2011
1. Introduction
A large fraction of RR Lyrae stars have been known to exhibit amplitude and phase modulation – the Blazhko effect (Blazhko 1907) – for about a century. We still lack quantitative constraints of the physical mechnisms driving and governing the Blazhko effect, thus limiting our understanding of the pulsation characteristics of RR Lyrae stars. Thanks to extensive ground-based observations, and those from both the Antarctica (Chadid et al. 2010b) and Konkoly observatory (Jurcsik et al. 2009), and the satellite missions, CoRoT (Chadid et al. 2010a) and Kepler (Benko et al. 2010), a continuous stream of data have been obtained to monitor in detail light curve changes during various Blazhko cycles. The ground-based observations clearly show that consecutive Blazhko cycles are not exactly periodic and also that the Blazhko period differs from cycle-to-cycle (Jurcsik et al. 2009; Chadid et al. 2010b). The CoRoT data, have found that the Blazhko phenomenon manifests itself as equidistantly spaced multiplets around the main pulsation frequency and its harmonics, which are not only triplet and quintuplet (as detected in ground-based observations) but also tenth order side peaks (Chadid et al. 2010a). These findings place strong constraints on the theoretical models proposed to explain the Blazhko effect. Stothers (2006, 2010) suggested that the turbulent/rotational dynamo mechanism generates, in some RR Lyrae stars, the magnetic fields that grow over the Blazhko cycle and suppress turbulent convection, and in turn small changes in the period of the fundamental radial mode. The physical mechanism suggested by Stothers appears very promising, but to fully exploit this hypothesis more detailed predictions about the key observables (amplitude, phase, period modulations) are required.
On the other hand, Preston et al. (1965) identified a weaker and a stronger Blazhko cycle in RR Lyr. Detre & Szeidl (1972) detected a cyclic modulation, 3.8 − 4.8 yrs, of the Blazhko amplitude, in RR Lyr itself. They suggested that, at the beginning of each four-year cycle, a significant discontinuity occurs in the Blazhko phase. To explain the empirical evidence, Detre & Szeidl (1973) suggested that the Blazhko period could be linked to the rotation period, and the 4-year cycle to the magnetic cycle in RR Lyr. An abrupt change in the Blazhko period at the beginning of a new 4-year cycle was also suggested by Stothers (1980) which might have been caused by either the sudden generation or destruction of the magnetic field. In this theoretical framework, the Blazhko phase discontinuity would be the consequence of a longitude shift (for more details, see Chadid & Gillet 1997). However, RR Lyr, the prototype magnetic, oblique rotator/pulsator model (Cousens 1983; Shibahashi 2000), has no detectable dipole over four years (Chadid et al. 2004).
The CoRoT space mission launched on 27 December 2006, with excellent time-sampling, unprecedented photometric precision and a long time base of 150 days, provides an excellent opportunity to study not only the variability of the star in detail, but also the long-term changes in the pulsation behavior.
In this paper, we discuss the discovery of a new RR Lyrae star, CoRoT ID 0105288363 in the Ophiuchus constellation which exhibits large cycle-to-cycle changes in the Blazhko modulation. The CoRoT data of CoRoT ID 0105288363 were obtained continuously and regularly during the second CoRoT long run centered on the Galaxy. We note that the CoRoTJD corresponds to HJD 2451545.0 (2000 January 1st, at 12h:00m:00s). In Sect. 2, we present CoRoT observations. Section 3 is focussed on the description of the data analysis and a discussion of the results. Amplitude and phase modulations are presented in Sect. 4, while the changes in the shape of the light curve and the long-term modulation are discussed in Sects. 5 and 6, respectively. Conclusions and final remarks are given in Sect. 7.
 |
Fig. 1 Two-dimensional CoRoT light curve of CoRoT ID 0105288363 folded with the pulsation period (0.5676 d) over four Blazhko cycles. The undulating behavior of the Blazhko maxima is clearly visible. |
2. CoRoT ID 0105288363 data
The target CoRoT ID 0105288363 ( ,
,  , J2000) is a new RR ab star with a visual magnitude V = 15.34 mag and a pulsation period P = 0.5676 d, discovered by the CoRoT Exoplanet CCDs during the second long run targeting the Galactic center – LRc02 – from 2008 April 15th to September 7th. The 145 d CoRoT data are calibrated light curves, the N2-level having an exposure time of 512 s, constant over whole LRc02 and giving a time resolutions of 1.04% of the pulsation period. The very high duty cycle-CoRoT collected around 24 000 data points produces a spectral window without any alias effect (Deboscher et al. 2009). The CoRoT N2 data are affected by jumps, trends and a long-term drift in the light curves due to changes in the amount of incident stray light during the run, periodic changes in flux caused by the satellite orbit, and discontinuities in the light curves due to cosmic ray hits on the CCDs (Auvergne et al. 2009). In order to remove the instrumental effects before performing the frequency analysis, we use the detrending and jumping algorithms following the methods described in Chadid et al. (2010a).
3. Frequency analysis
The frequency analysis was performed using different packages such as Period04 (Lenz & Breger 2005), the package MuFrAn (Kollàth 1990), the CLEAN algorithm introduced by Roberts et al. (1987), and the PDM method (Stellingwerf 1978). The different algorithms led to the same results with only marginal differences at higher orders. In this study, we present the results of the Period04 frequency analysis. The Fourier decomposition consists of fitting the magnitude measurements with the series ![Mathematical equation: \begin{equation} m(t) = A_0 + \sum_{i=1, N}A_i\sin[2 \pi F_i(t - T_0) + \Phi_i], \end{equation}](/articles/aa/full_html/2011/03/aa16048-10/aa16048-10-eq10.png) (1)where T0 = 3027.0000 is the initial epoch value of the data set CoRoTJD. As a first step, we carried out a Fourier analysis of our data. Almost one hundred significant frequencies are clearly detected. Determing the point at which we should stop the frequency analyses is a well-known but unsolved problem. In General, the threshold of a certain signal-to-noise ratio is accepted as a significance level. In our case of a value sig = 5 value served as an overall criterion. However, the regular behavior of harmonics and side peaks in the Blazhko RR Lyrae stars helps us even to identify frequency peaks, intrinsic to the star’s pulsation, of a lower amplitude than the accepted value. By means of a rigorous check in the high-frequency region, where the noise level is lower, we were able to detect the harmonics and their side peaks below the generally accepted significance level.
(1)where T0 = 3027.0000 is the initial epoch value of the data set CoRoTJD. As a first step, we carried out a Fourier analysis of our data. Almost one hundred significant frequencies are clearly detected. Determing the point at which we should stop the frequency analyses is a well-known but unsolved problem. In General, the threshold of a certain signal-to-noise ratio is accepted as a significance level. In our case of a value sig = 5 value served as an overall criterion. However, the regular behavior of harmonics and side peaks in the Blazhko RR Lyrae stars helps us even to identify frequency peaks, intrinsic to the star’s pulsation, of a lower amplitude than the accepted value. By means of a rigorous check in the high-frequency region, where the noise level is lower, we were able to detect the harmonics and their side peaks below the generally accepted significance level.
CoRoT ID 0105288363 provides 256 consecutive pulsation cycles and a homogeneous coverage of 4 Blazhko cycles. The measurement around the maximum and minimum brightnesses were fitted by means of a least-squares polynomials. We obtained the ephemeris

 In this paper, the pulsation phase is φ and the Blazhko phase is ψ.
3.1. The main radial pulsation
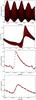 |
Fig. 2 Top: CoRoT light curve of CoRoT ID 0105288363 over four Blazhko cycles. The variations in the light curve due to the irregular Blazhko effect are clearly visible. Middle: light curve of CoRoT ID 0105288363 at the maximum of the Blazhko phase ψ = 0.00. Bottom: light curve of CoRoT ID 0105288363 at the minimum of the Blazhko phase ψ = 0.50. |
A detailed visual inspection of CoRoT ID 0105288363 data (Fig. 1) shows that the star is a RR ab and identifies strong changes between consecutive Blazhko cycles. The alternating higher and lower maxima of the Blazhko cycle are clearly observed (see Fig. 2, top). Because of this phenomenon, a large number of close frequencies are detected in the vicinity of the main frequency and harmonics (Fig. 3), which ensures that the frequency analysis is a nontrivial task. To account for this, a separate frequency analysis of each Blazhko cycle (the first, second, third, and fourth Blazhko cycle) is performed and listed in Table 2. Figure 4 describes the different steps in the frequency detection at the first Blazhko cycle. The spectrum in the top panel clearly shows the radial fundamental pulsation, the main frequency f0 = 1.762 d-1, and significant harmonics up to 11f0, when applying a significance criterion for a signal-to-noise ratio of 5. Their amplitude decreases monotonically and has the same behavior for the four Blazhko cycles, except for the higher order (Fig. 6, left column). The detection of the high order harmonics of the main frequency shows the nonlinear behavior of the radial pulsation.
3.2. High-order multiplet structure and Blazhko frequency
Figure 5 shows the residual spectrum after prewhitening with the main frequency and its harmonics in CoRoT ID 0105288363. Besides the triplet and quintuplet (Fig. 4), we also detected up to quindecaplet structure. Figure 7 shows a map of the harmonics and side peak structures, listed in Table 2. The high-order side peak structure has already been detected in CoRoT ID 0100689962 showing the non-linear nature of the Blazhko modulation up to sepdecaplet structure (Chadid et al. 2010a). The high-order multiplet structure could be caused by nonradial modes close to the main pulsation and its many combinations (Chadid et al. 2010a) or it could result from the modulation of a purely radial pulsation (Szeidl et al. 2009).
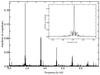 |
Fig. 3 Fourier spectra of the light curve. The insert panel shows the enlargement centered at the main frequency. |
 |
Fig. 4 The upper panel shows the amplitude spectrum at the first Blazhko period of CoRoT ID 0105288363. The other three panels are the residual spectrum after prewhitening with the main frequency and its harmonics, the triplets and its harmonics and when all frequencies in Table 2 are removed. The insert panels show the enlargements centered on the main frequency, triplets and quintuplets. |
 |
Fig. 5 Residual spectrum after prewhitening with the main frequency and its harmonics of CoRoT ID 0105288363, a) at the first Blazhko period, b) at second Blazhko period, c) at third Blazhko period, d) at fourth Blazhko period, and e) total light curve. |
We plotted the order of side peaks k versus harmonic orders n in the formula nf0 + kfm (Fig. 7). It is clear that more side peaks appear on the negative, higher-frequency sides (k < 0, left) than on the positive, lower-frequency sides (right). The general amplitude behavior of the side peaks is presented in Fig. 6 for different kinds of multiplet peaks. The amplitude of triplet side peaks (left and right) runs parallel along straight lines on the logarithmic scale for the four Blazhko cycles. There is a slight difference in the amplitude of side peaks at the eleventh harmonic of the second and fourth Blazhko cycle. Although the inclination of the lines are similar for the four Blazhko cycles, there is a remarkable difference in the amplitude of the left and right side peaks in the quintuplet structure, in particular between the third and ninth harmonics. The parameter of the degree of asymmetry Q, introduced by Alcock et al. (2003), was measured for the four Blazhko cycles and indicates a value of −0.02, −0.05, −0.01, and −0.045 from the first to fourth Blazhko cycle, respectively, and finds that the triplet structure has a very smooth asymmetry. The left side peak amplitudes are weakly stronger than those of the right. The asymmetry is more pronounced during the second, fourth, first, and third Blazhko cycle.
We estimate the Blazhko frequency from the multiplet structure (nf0 ± kfm) and point out a value of 0.0325 d-1 (30 769 d), 0.0315 d-1 (31 746 d), 0.0311 d-1 (32 154 d), and 0.027 d-1 (37 037 d) from the first to fourth Blazhko cycle, respectively. We note that a Blazhko modulation frequency 0.0281 d-1 (35 587 d) is detected in the spectrum when we analyze the data covering the four Blazhko cycles.
4. Amplitude and phase modulations
Following the same approach we adopted for CoRoT ID 0100689962 (Chadid et al. 2010a), the instantaneous amplitudes and frequencies were determined for CoRoT ID 0105288363 using the analytical signal method suggested by Kollath et al. (2002). The periodic variation in the frequency was found with a period equal to that of the amplitude variation. This means that we interpret the phase modulation as a period variation during the modulation cycle. The Blashko RR Lyrae CoRoT ID 105288363 exhibits small phase variations (ΔP / P = 0.0030). However, the amplitude of the Blazhko modulation shows significant variations along the different cycles (see e.g. Sect. 3.1). The top and the midle panel of Fig. 8 show the modulation of maximum and minimum brightness together with the phase modulation during the four Blazhko cycles. The phase and the amplitude variation undergo significantly changes along consecutive Blazhko cycles. The bottom panel of Fig. 8 shows the curves for the four Blazhko cycles, corresponding to the maximum brightness and phase values obtained by fitting with a sixth order Fourier sum the light curves. Data plotted in this figure indicate that both the minimum and the maximum brightness appears to be correlated with the phase, i.e. they are brighter when they occur at later pulsation phases. Another striking feature is that the maximum brightness-phase curve has signifcantly different shapes during consecutive cycles. The width of the diagram indicates that a phase shift is present in all maximum brightness-phase curves. The width is larger in the third and second cycles. The fourth cycle has a closer resemblance to the first one with only a small phase shift. The maximum brightness-phase curve of all Blazhko cycles delineates an open loop, which is a consequence of the Blazhko period changes, and an anti-clockwise direction, indicating that the maximum brightness variation is lagging when compared to the phase of maximum. This empirical evidence is consistent with the physical mechanism suggested by Stothers (2006, 2010) to account for the Blazhko effect. The key prediction of this hypothesis is that a physical mechanism, probably a dynamo generating a magnetic field in the envelope of RR Lyrae stars, suppresses the turbulent convection, and in turn causes a mild change in the mean density in the nonadiabatic regions of the envelope (Bono & Stellingwerf 1993), hence in the pulsation period. The open loops plotted in the bottom panels of Fig. 8 indicate that the phase shift might be associated with the suppression of the turbulent convection. This working hypothesis is consistent with the luminosity amplitude attaining its maximum value just before this phase. This also indicates that the turbulent convection becomes less and less efficient (see Fig. 2) during these phases of the Blazhko cycle. On the other hand, the convective transport is particularly efficient close to the minimum of the Blazhko cycle, since during these phases the amplitude attains its minimum value.
5. Changes in the shape of the light curve
As discussed in Sect. 3.1, the CoRoT ID 0105288363 light curve reveals a nonlinear effect of the main radial pulsation together with a significant asymmetry. The prototype RR Lyr itself shows the irregularity phenomenon (Chadid 2000), i.e. there is no repetition from one main pulsation cycle to another. We later interpreted the detected residual scatter of RR Lyr itself as a consequence of the irregularity phenomenon (Chadid & Chapellier 2006). The Blashko RR Lyrae CoRoT ID 0105288363, (see Fig. 9) is marginally affected by this phenomenon, and indeed the residuals plotted in Fig. 10 show a large spread in the phase interval of the rising branch. In passing, we note that these nonlinearities in the radial pulsation are strongly connected with the shock wave propagation in the atmosphere of the RR Lyrae stars.
In order to provide quantitative constraints on the nonlinearities affecting the light curve we investigated the changes both in amplitude and in phase of the bump. Data plotted in Fig. 11 clearly indicate that the above quantities are clearly anticorrelated with the fundamental pulsation period. The minimum in the bump amplitude takes place at earlier pulsation phases when the Blashko cycle attains its minimum amplitude and the fundamental radial mode approaches its longest oscillation period. In particular, the bump amplitude becomes larger then 0.1 mag around the maximum of the Blazhko cycle and alomst disappears (a few hundredths of mag) if close to the minimum (Fig. 11). In the former case it takes place at later phases (φ ~ 0.74), while in the latter case it takes place significantly earlier (at φ ~ 0.55). As suggested by Hill (1972), the bump is caused by a secondary shock, named early shock, generated by the collision between the inward motion of the outermost layers of the atmosphere and by the outward motion of the deeper layers. Our early spectroscopic work on RR Lyr (Chadid & Gillet 1996) confirmed Hill’s hypothesis by the detection of the secondary acceleration of the RR Lyrae photosphere at the bump phases, which is a consequence of the early shock. This means that the early shock in CoRoT ID 0105288363 is stronger as soon as the Blazhko cycle is approaching its maximum extent.
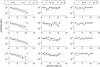 |
Fig. 6 Amplitude ratios of the harmonic components of the radial pulsation given in decimal logarithmic scale (Anf0 / Af0) compared to the amplitude ratios of the modulation components (Anf0 + kfm) / Af0 + kfm). From top to bottom, the panels show the amplitude ratios for the first, second, third, and fourth Blazhko cycle. |
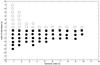 |
Fig. 7 Map of harmonics and side peaks in the Fourier spectrum of CoRoT ID 0105288363. The order of the side frequencies (k) versus harmonic orders (n) is plotted according to the formula nf0 + kfm. Open circles denote k > 0, filled circles k < 0, and squares k = 0, respectively. |
 |
Fig. 8 Top: minimum and maximum brightness as a function of time. Data for different Blashko cycles are plotted using different colors. Middle: same as the top but for the phase of both minimum and maximum brightness. Bottom: maximum brightness-maximum phase plot, with sixth order harmonics fits, of CoRoT ID 0105288363 at the first (black), second (blue), third (red), and fourth Blazhko period (green). The arrows indicate the direction of the modulation. |
Similar evidence concerning the anticorrelation between the Blazhko amplitude and the period of the fundamental radial mode has also been found in other field Blazhko RR Lyrae by Chadid et al. (2010a,b), by Poretti et al. (2010) and more recently by Kolenberg et al. (2010) for the prototype RR Lyr itself. However, the field Blazhko RR Lyrae CoRoT ID 0105288363 appears to be crucial in this context, since it provides – together with the above evidence of the suppression of the turbulent convection in consecutive Blazhko cycles – a strong support to the slow convective cycle model recently suggested by Stothers (2006, 2010). The reason is twofold.
-
i)
For hotter (shorter period) Blazhko RR Lyrae,the pulsation period increases and the luminosity amplitudedecreases as the convective efficiency increases along the Blazhko cycle. This prediction is soundly supported by the decrease in the amplitude of the bump close to the minimum in the Blazhko amplitude and by the increase in the same phases of the fundamental pulsation period.
-
ii)
The shape of the light curve is also supporting the above prediction. Theoretical (Stellingwerf 1984; Bono & Stellingwerf 1994) and empirical (Benz & Stellingwerf 1985) evidence indicate that an increase in the convective efficiency makes the light curves more sinusoidal and the rising branch shallower. The behavior of both skewness and acutness of the light curve along the Blazhko cycle and their anticorrelation with fundamental pulsation period further support the above hypothesis.
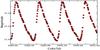 |
Fig. 9 Long light curve of CoRoT ID 0105288363. |
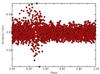 |
Fig. 10 The CoRoT data folded with main pulsation after subtracting all detected frequencies listed in Table 2. |
6. Long-term variations
As already discussed in Sect. 1, a possible variation in the Blazhko effect has been reported several times and even the suspected second modulation of the main pulsation, namely, long-term modulation. In the analysis of the Blazhko effect of MW Lyrae (fB = 0.060 d-1), Jurcsik et al. (2008) identified secondary peaks around the main pulsation terms separated by a periodicity comparable to the time baseline, of ~500 d. Using the diagram of the maximum of both brightness and phase, we illustrated the instability of the subsequent Blazhko cycles in CoRoT ID 0100689962 by applying a shift of the maximum phase around 0.011 pulsation phase (5.6 min) during the five covered Blazhko cycles, which is probably the consequence of a long-term modulation (Chadid et al. 2010a). In the same way, we detected a peak close to zero in the spectrum of the magnitudes at maximum of the CoRoT ID 0101128793, which is a signature of long-term variation, over a timescale longer than that covered by the CoRoT data (Poretti et al. 2010). However, none of these studies have been able to observe the varying Blazhko effect directly.
 |
Fig. 11 Relationship between the period change and variation in the amplitude and the phase of the bump (on the left), and in the skewness and the acuteness (on the right) of CoRoT ID 0105288363 at the first (black), second (blue), third (red), and fourth Blazhko period (green). |
A frequency analysis of the maximum brightness of CoRoT ID 0105288363 is given in Fig. 12. A glance at the data plotted in this figure shows several interesting features: the Blazhko frequency fm = 0.029 d-1 is detected as a dominant frequency with its harmonics up to third order. After prewhitening of fm and its harmonics, we clearly detected a triplet structure, with an equal separation around the Blazhko frequency and its harmonics (which we refer to as the Blazhko triplet structure) nfm ± fm′ with n ≼ 3. The left side peak, at frequency fm − fm′ = 0.0237 d-1, and the right one, at frequency fm + fm′ = 0.0369 d-1, are separated by the frequency 2fm′ = 0,0132 d-1, inferring a frequency value fm′ = 0,0066 d-1 equivalent to 151.51 days, which clearly indicates the value of the modulation of the Blazhko frequency. Table 1 lists the Blazhko triplet frequencies.
We point out that the left side peaks at frequencies fm − fm′ = 0.0237 d-1, 2fm − fm′ = 0.0509 d-1, and 3fm − fm′ = 0.0804 d-1 beat against the Blazhko frequency, fm = 0.029 d-1, with periods of 181.81, 133.33, and 138.88 days, with an average of around 151.34 days, which is consistent with the modulation of the frequency Blazhko fm′.
We calculated the degree of asymmetry QB of the Blazhko triplet structure and found a value around − 0.75, which reflects the complete asymmetry of the triplet structure with the left side peak amplitudes are higher than those of the right. We also detected the modulation of the Blazhko frequency fm′ = 0.0066 ± 0.0003 d-1 as an independent frequency in the Fourier spectrum of maximum brightness. Theses results represent a direct detection of the long-term modulation, of CoRoT ID 0105288363 around 151 ± 7 days, which has never been detected so far. However, a more complete coverage of the entire long-term cycle would lead to a more accurate determination of the real value of the CoRoT ID 0105288363 long-term period and indicate quantitatively the multiplet structure around the Blazhko cycle.
Blazhko triplet frequencies of CoRoT ID 0105288363.
 |
Fig. 12 Top: power spectrum of the magnitudes at maximum brightness. Bottom: power spectrum after prewhetening of the Blazhko frequency and its harmonics. |
7. Summary
The CoRoT data, with their excellent time sampling, high photometric precision, and long time base of 145 days, have allowed us to disclose new and puzzling results about the RR ab star CoRoT ID 0105288363, detected during the second CoRoT long run targeting the center of the Galaxy. The new results will contribute to our understanding of the physical mechanisms governing the pulsation properties of RR Lyrae stars. In particular, we have found that:
-
the main pulsation of CoRoT ID 0105288363exhibits multiplet structures – seventh order side peaks – with theleft side peak amplitudes being higher than those of the right. Thishas never previously been detected.
-
After investigating the bump behaviour along consecutive Blazhko cycles, the amplitude and the phase of the bump are correlated with the Blazhko phase, and anticorrelated with the fundamental pulsation period; the bump occurred at later pulsation phases and the amplitude of the bump approaches the maximum in coincidence of the maximum of the Blazhko cycle. Moreover, the skewness and the acuteness of the light curve show significant changes along consecutive Blazhko cycles, and are strongly anticorrelated with the fundamental pulsation period. This provides a strong support to the slow convective cycle model suggested by Stothers.
-
We also detected a secondary modulation of 151 ± 7 days, namely long-term modulation, in CoRoT ID 0105288363 data, as an independent frequency in spectrum of maximum brightness fm′ = 0.0066 ± 0.0003 d-1. A triplet Blazhko-modulation structure is clearly also detected in the spectrum of the maximum brightness, centered on the Blazhko frequency fm with an equidistant frequency spacing of fm′. The side peaks are indicative of a large asymmetry in the modulation amplitudes the left side peak being higher than the right one.
Acknowledgments
We wish to thank George Preston for reading the manuscript and for many helpful comments that greatly improved this article.
We also thank the referee for comments and the entire CoRoT team for the outstanding efforts.
References
- Alcock, C., Alves, D. R., Becker, A., et al. 2003, ApJ, 598, 597 [NASA ADS] [CrossRef] [Google Scholar]
- Auvergne, M., Bodin, P., Boisnard, L., et al. 2009, A&A, 506, 411 [NASA ADS] [CrossRef] [EDP Sciences] [Google Scholar]
- Benkő, J. M., et al. 2010, MNRAS, 1514, 435 [Google Scholar]
- Benz, W., Stellingwerf, R. F. 1985, ApJ, 297, 686 [NASA ADS] [CrossRef] [Google Scholar]
- Blazhko, S. 1907, Astron. Nachr., 175, 325 [NASA ADS] [CrossRef] [Google Scholar]
- Bono, G., & Stellingwerf, R. F. 1993, Proc. IAU Colloq., 139, 262 [NASA ADS] [Google Scholar]
- Bono, G., & Stellingwerf, R. F. 1994, ApJS, 93, 233 [NASA ADS] [CrossRef] [Google Scholar]
- Chadid, M., & Gillet, D. 1996, A&A, 308, 481 [NASA ADS] [Google Scholar]
- Chadid, M., & Gillet, D. 1997, A&A, 319, 154 [NASA ADS] [Google Scholar]
- Chadid, M. 2000, A&A, 359, 991 [NASA ADS] [Google Scholar]
- Chadid, M., & Chapellier, E. 2006, A&A, 456, 305 [NASA ADS] [CrossRef] [EDP Sciences] [Google Scholar]
- Chadid, M., Wade, G. A., Shorlin, S. L. S., & Landstreet, J. D. 2004, A&A, 413, 1087 [NASA ADS] [CrossRef] [EDP Sciences] [Google Scholar]
- Chadid, M., Vernin, J., & Gillet, D. 2008, A&A, 491, 537 [NASA ADS] [CrossRef] [EDP Sciences] [Google Scholar]
- Chadid, M., Benkő, J. M., Szabó, R., et al. 2010a, A&A, 510, A39 [NASA ADS] [CrossRef] [EDP Sciences] [Google Scholar]
- Chadid, M., Vernin, J., Mekarnia, D., et al. 2010b, A&A, 516, A15 [NASA ADS] [CrossRef] [EDP Sciences] [Google Scholar]
- Cousens, A. 1983, MNRAS, 203, 1171 [NASA ADS] [CrossRef] [Google Scholar]
- Deboscher, J., Sarro, L. M., López, M., et al. 2009, A&A, 506, 519 [NASA ADS] [CrossRef] [EDP Sciences] [Google Scholar]
- Detre, L., & Szeidl, N. 1972, IAU Coll., 21, 31 [Google Scholar]
- Detre, L., & Szeidl, N. 1973, IBVS. 764, 1 [Google Scholar]
- Jurcsik, J., Sódor, Á., Hurta, Zs., et al. 2008, MNRAS, 391, 164 [NASA ADS] [CrossRef] [Google Scholar]
- Jurcsik, J., Hurta, Zs., Sódor, Á., et al. 2009, MNRAS, 397, 350 [NASA ADS] [CrossRef] [Google Scholar]
- Kolláth, Z. 1990, Occ. Tech. Notes Konkoly Obs., Budapest, 1 [Google Scholar]
- Kolláth, Z., Buchler, J. R., Szabó, R., & Csubry, Z. 2002, A&A, 385, 932 [NASA ADS] [CrossRef] [EDP Sciences] [Google Scholar]
- Lenz, P., & Breger, M. 2005, CoAst., 146, 53 [Google Scholar]
- Poretti, E., Papparo, M., Deleuil, M., Chadid, M., et al. 2010, A&A, 398, 213 [Google Scholar]
- Preston, G W., Smak, J., & Paczyński, B. 1965, ApJS, 12, 99 [NASA ADS] [CrossRef] [Google Scholar]
- Roberts, D. H., Lehar, J., & Dreher, J. W. 1987, AJ, 93, 968 [NASA ADS] [CrossRef] [Google Scholar]
- Shibahashi, H. 2000. ASP Conf. Ser., 203, 299 [Google Scholar]
- Smith, H. A., Church, J. A., Fournier, J., et al. 2003, PASP, 115, 43 [NASA ADS] [CrossRef] [Google Scholar]
- Stellingwerf, R. F. 1978, ApJ, 224, 953 [NASA ADS] [CrossRef] [Google Scholar]
- Stellingwerf, R. F. 1984, ApJ, 284, 712 [NASA ADS] [CrossRef] [Google Scholar]
- Stellingwerf, R. F., & Donohoe, M. 1987, ApJ, 314, 252 [NASA ADS] [CrossRef] [Google Scholar]
- Stothers, R. B. 1980, PASP, 92, 475 [NASA ADS] [CrossRef] [Google Scholar]
- Stothers, R. B. 2006, ApJ, 652, 643 [NASA ADS] [CrossRef] [Google Scholar]
- Stothers, R. B. 2010, PASP, 122, 536 [NASA ADS] [CrossRef] [Google Scholar]
- Szeidl, B., & Jurcsik, J., 2009, CoAst, 160, 17 [Google Scholar]
All Tables
All Figures
|
Fig. 1 Two-dimensional CoRoT light curve of CoRoT ID 0105288363 folded with the pulsation period (0.5676 d) over four Blazhko cycles. The undulating behavior of the Blazhko maxima is clearly visible. |
| In the text | |
|
Fig. 2 Top: CoRoT light curve of CoRoT ID 0105288363 over four Blazhko cycles. The variations in the light curve due to the irregular Blazhko effect are clearly visible. Middle: light curve of CoRoT ID 0105288363 at the maximum of the Blazhko phase ψ = 0.00. Bottom: light curve of CoRoT ID 0105288363 at the minimum of the Blazhko phase ψ = 0.50. |
| In the text | |
|
Fig. 3 Fourier spectra of the light curve. The insert panel shows the enlargement centered at the main frequency. |
| In the text | |
|
Fig. 4 The upper panel shows the amplitude spectrum at the first Blazhko period of CoRoT ID 0105288363. The other three panels are the residual spectrum after prewhitening with the main frequency and its harmonics, the triplets and its harmonics and when all frequencies in Table 2 are removed. The insert panels show the enlargements centered on the main frequency, triplets and quintuplets. |
| In the text | |
|
Fig. 5 Residual spectrum after prewhitening with the main frequency and its harmonics of CoRoT ID 0105288363, a) at the first Blazhko period, b) at second Blazhko period, c) at third Blazhko period, d) at fourth Blazhko period, and e) total light curve. |
| In the text | |
|
Fig. 6 Amplitude ratios of the harmonic components of the radial pulsation given in decimal logarithmic scale (Anf0 / Af0) compared to the amplitude ratios of the modulation components (Anf0 + kfm) / Af0 + kfm). From top to bottom, the panels show the amplitude ratios for the first, second, third, and fourth Blazhko cycle. |
| In the text | |
|
Fig. 7 Map of harmonics and side peaks in the Fourier spectrum of CoRoT ID 0105288363. The order of the side frequencies (k) versus harmonic orders (n) is plotted according to the formula nf0 + kfm. Open circles denote k > 0, filled circles k < 0, and squares k = 0, respectively. |
| In the text | |
|
Fig. 8 Top: minimum and maximum brightness as a function of time. Data for different Blashko cycles are plotted using different colors. Middle: same as the top but for the phase of both minimum and maximum brightness. Bottom: maximum brightness-maximum phase plot, with sixth order harmonics fits, of CoRoT ID 0105288363 at the first (black), second (blue), third (red), and fourth Blazhko period (green). The arrows indicate the direction of the modulation. |
| In the text | |
|
Fig. 9 Long light curve of CoRoT ID 0105288363. |
| In the text | |
|
Fig. 10 The CoRoT data folded with main pulsation after subtracting all detected frequencies listed in Table 2. |
| In the text | |
|
Fig. 11 Relationship between the period change and variation in the amplitude and the phase of the bump (on the left), and in the skewness and the acuteness (on the right) of CoRoT ID 0105288363 at the first (black), second (blue), third (red), and fourth Blazhko period (green). |
| In the text | |
|
Fig. 12 Top: power spectrum of the magnitudes at maximum brightness. Bottom: power spectrum after prewhetening of the Blazhko frequency and its harmonics. |
| In the text | |
Current usage metrics show cumulative count of Article Views (full-text article views including HTML views, PDF and ePub downloads, according to the available data) and Abstracts Views on Vision4Press platform.
Data correspond to usage on the plateform after 2015. The current usage metrics is available 48-96 hours after online publication and is updated daily on week days.
Initial download of the metrics may take a while.